David Richard-USA TODAY Sports
José Ramírez is the definition of a set-it-and-forget-it player, and I mean that at least a little bit literally. Neither we nor our friends over at Baseball Prospectus published a single article that focused on him during a 2023 season when, for the fourth time in a row, he finished in the top 10 in the AL MVP voting. He turned out to have a very interesting season, and not just because he was, as always, excellent.
In June of 2022, Ramírez injured the ulnar collateral ligament in his right thumb. To the surprise of the Cleveland coaching staff, he decided to play through significant pain and postpone surgery until the offseason. Despite seeing his power drop off dramatically, he ended the season with a 141 wRC+ and 6.4 WAR. He finally had the surgery in November and came into the 2023 season healthy, but he got off to a slow start and finished with a 123 wRC+. It was his worst showing since 2019, when a broken hamate bone ended his season prematurely. (As an aside, if you’re desperate for for reassurance that Mike Trout will bounce back from his hamate injury, look no further than Ramírez, who immediately returned to superstardom in 2020.)
The graph below spans three years so you can see Ramírez in his healthy 2021 season, then how his power trailed off after the injury in ‘22, then the shape of his 2023 season.
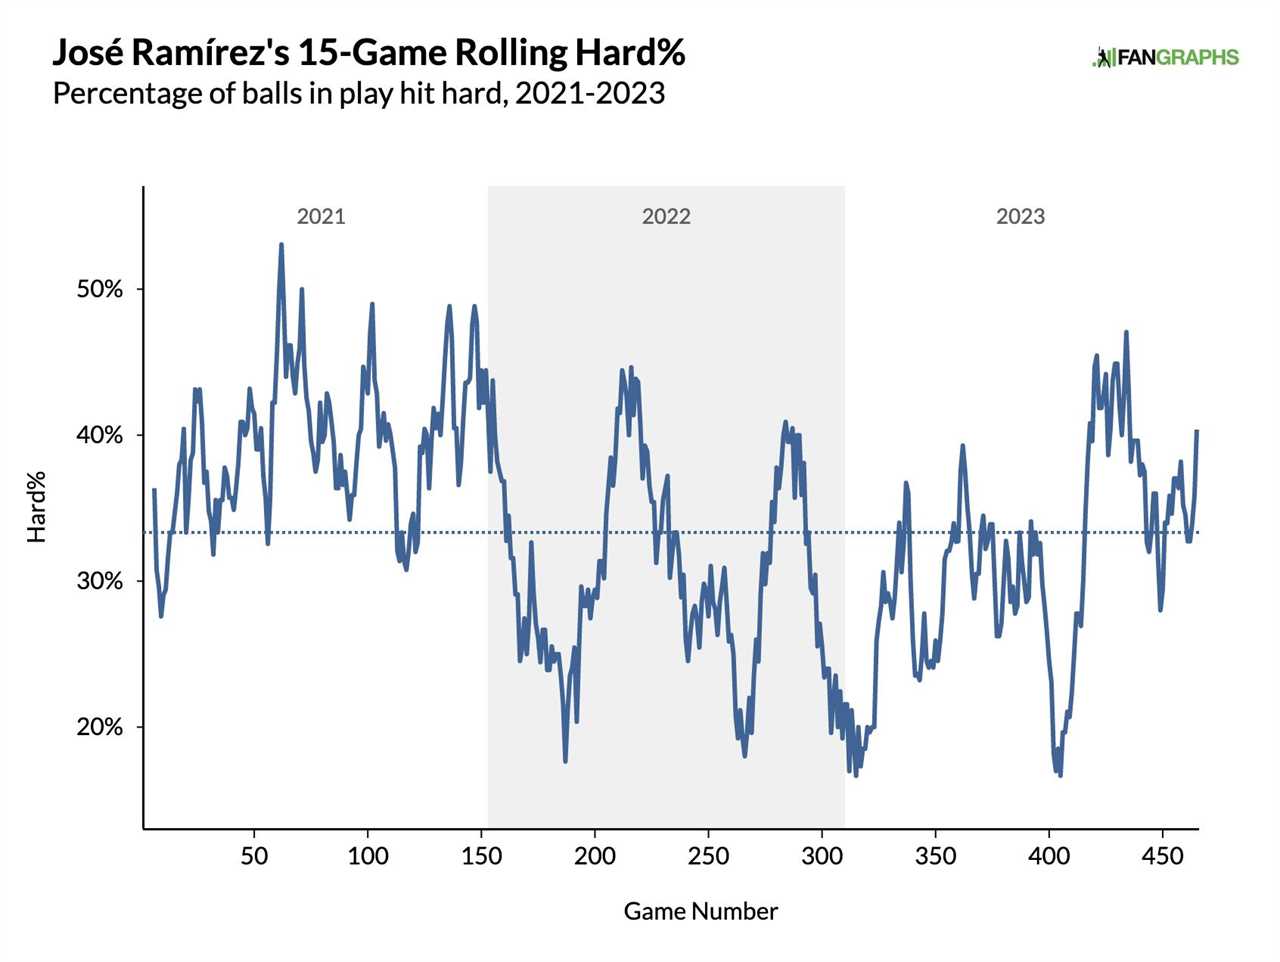
At first blush, this is an easy story to tell. Hand surgery tends to rob hitters of strength, and it took a while for all those tiny muscles in Ramírez’s hand to get back to normal. That big spike on the right side of the graph started growing on June 7, when he kicked off a nine-game hitting streak by going 2-for-4 with an RBI double in a win over the Red Sox. Here are his 2023 stats, using that date as a dividing line:
José Ramírez Flips the Switch
| Date |
PA |
HR |
ISO |
EV |
HH% |
wRC+ |
| Before June 7 |
252 |
6 |
.170 |
89 |
38 |
101 |
| Starting June 7 |
439 |
18 |
.206 |
90.6 |
41.9 |
136 |
Ramírez started hitting the ball much harder. He hit three times as many home runs in well under half as many plate appearances. In fact, he ended the season with a 90-mph average exit velocity, the highest of his career. Those tiny little muscles really matter. But while it’s a true story, it’s not the whole story. Here are some more stats using that same dividing line:
José Ramírez Gets Less Unlucky
| Date |
BABIP |
xwOBACon |
xwOBACon |
wOBA |
xwOBA |
BB% |
K% |
| Before June 7 |
.261 |
.317 |
.353 |
.315 |
.345 |
9.9 |
8.7 |
| Starting June 7 |
.299 |
.384 |
.390 |
.364 |
.369 |
10.9 |
11.6 |
For the first 60 games of the season, Ramírez wasn’t hitting the ball as hard but was also somewhat unlucky (though some of it was due to his batted ball mix, which we’ll get to later). At the same time, he was putting the ball in play more often. His walk rate was a bit lower, and his strikeout rate was more than a bit lower. To put those numbers in context, since 2016, Ramírez has run a 10.5% walk rate and a 12% strikeout rate. Those first 60 games were the outlier.
What was he doing differently? It’s not that he was chasing more or making a lot less contact. It’s that he was more aggressive on pitches in the zone.
José Ramírez Attacks Strikes
| Date |
Whiff% |
Z-Swing% |
Chase% |
| Before June 7 |
16.4 |
71.2 |
28.3 |
| Starting June 7 |
15.1 |
65 |
28.1 |
Once again, the first row is the outlier, and the second row is right in line with Ramírez’s career numbers. He ended the season with a swing rate of 70.3% on pitches in the zone. That’s the highest rate of his career, all because of those first 60 games.
Swinging at more pitches in the zone is usually a good thing, but look what happens if we use Baseball Savant’s attack zones and break the strikes down into pitches over the heart of the plate and pitches in the shadow zone. The table below is just his swing rate:
Specifically Borderline Strikes
| Date |
Heart |
Shadow |
| Before June 7 |
73.4 |
69.1 |
| Starting June 7 |
73.7 |
54.6 |
Now we’re getting somewhere. Again, the table above only relates to pitches in the strike zone; it doesn’t include pitches that were in the shadow zone but outside the zone. At the beginning of the season, despite not chasing more, Ramírez didn’t really distinguish between pitches over the heart of the plate and pitches on the edges of the strike zone. After June 7, his swing rate on strikes in the shadow zone dropped back down to and even below his career rate of 57.6%.
To illustrate the importance of that change, I’m going to show you an unholy amalgam of two graphs from Pitcher List. I took Ramírez’s strike zone judgment graph, and on top of it, I crudely pasted his decision value graph. The white line shows how often Ramírez made the right call if you look at things in black and white: swing at pitches likely to be called strikes, and lay off pitches likely to be called balls. The purple line shows more nuance, modeling the run value of a swing or take on any given pitch, then crediting or debiting the hitter based on each decision.
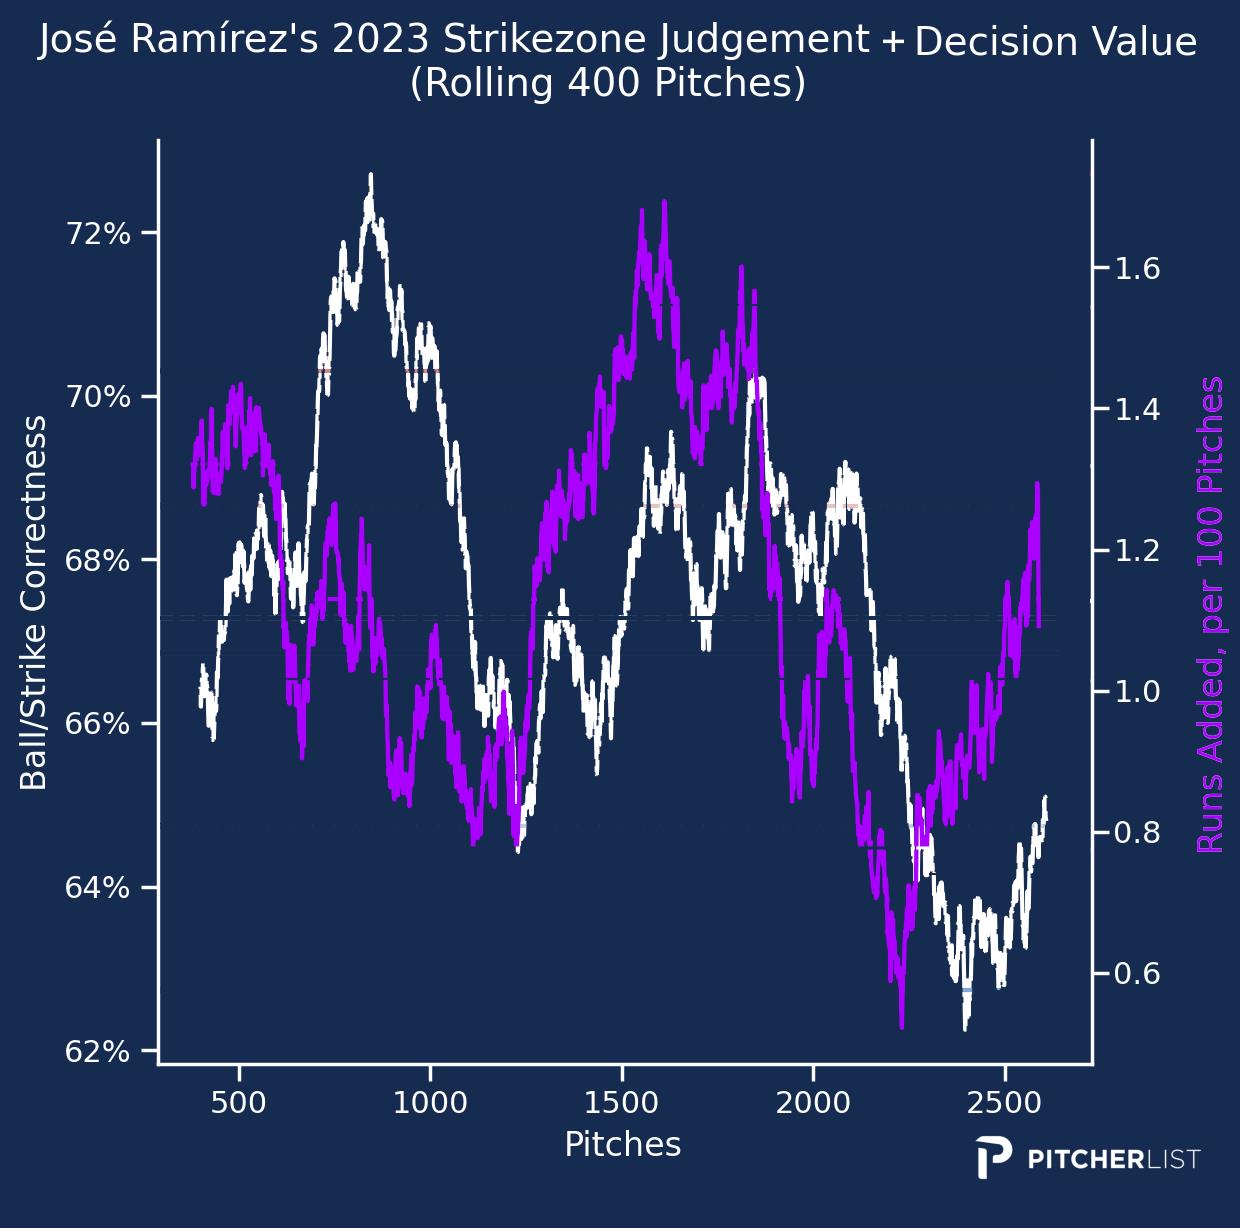
See the big gap between the white and purple lines at the beginning of the chart? Before his production took off, Ramírez was swinging at strikes and laying off balls, but he wasn’t necessarily swinging at hittable pitches, especially fastballs.
I mentioned earlier that when Ramírez underperformed his wOBA during that early stretch, he might have been experiencing more than bad luck. That’s because his batted ball distribution changed drastically:
José Ramírez Balls in Play
| Date |
GB/FB |
LD% |
GB% |
FB% |
IFFB% |
HR/FB |
| Before June 7 |
0.64 |
20.0% |
31.2% |
48.8% |
17.0% |
6.0% |
| Starting June 7 |
0.94 |
23.9% |
36.9% |
39.2% |
13.5% |
13.5% |
| Career |
0.86 |
20.4% |
36.8% |
42.8% |
12.4% |
12.2% |
Ramírez hit tons of fly balls, and he also hit more balls to center field, where it takes more power to do damage. That’s not a recipe for success if you’re doing so at a time when you’re hitting the ball more weakly. He also increased his popup rate dramatically. Striking out less doesn’t help at all if you’re just replacing those strikeouts with a different kind of automatic out.
That said, there really was some bad luck going on here. This table is his performance solely on strikes in the shadow zone:
José Ramírez Shadow Zone Strikes
| Date |
wOBA |
xwOBA |
EV |
HH% |
| Before June 7 |
.260 |
.353 |
89 |
42.3 |
| Starting June 7 |
.391 |
.364 |
90.8 |
42.1 |
Ramírez underperformed his xwOBA by nearly 100 points. It’s hard to chalk all of that up to batted ball distribution. On pitches over the heart of the plate, he was still hitting the ball much softer, but his actual and expected performance was roughly the same:
José Ramírez Heart Strikes
| Date |
wOBA |
xwOBA |
EV |
HH% |
| Before June 7 |
.408 |
.403 |
91.7 |
43.3 |
| Starting June 7 |
.421 |
.406 |
93.7 |
52 |
There’s a lot more nuance at play than we have time to dig into. For example, there’s the fact that Ramírez is a switch-hitter. Here are two more swing decision charts, with Ramírez as a lefty on the left and as a righty on the right:
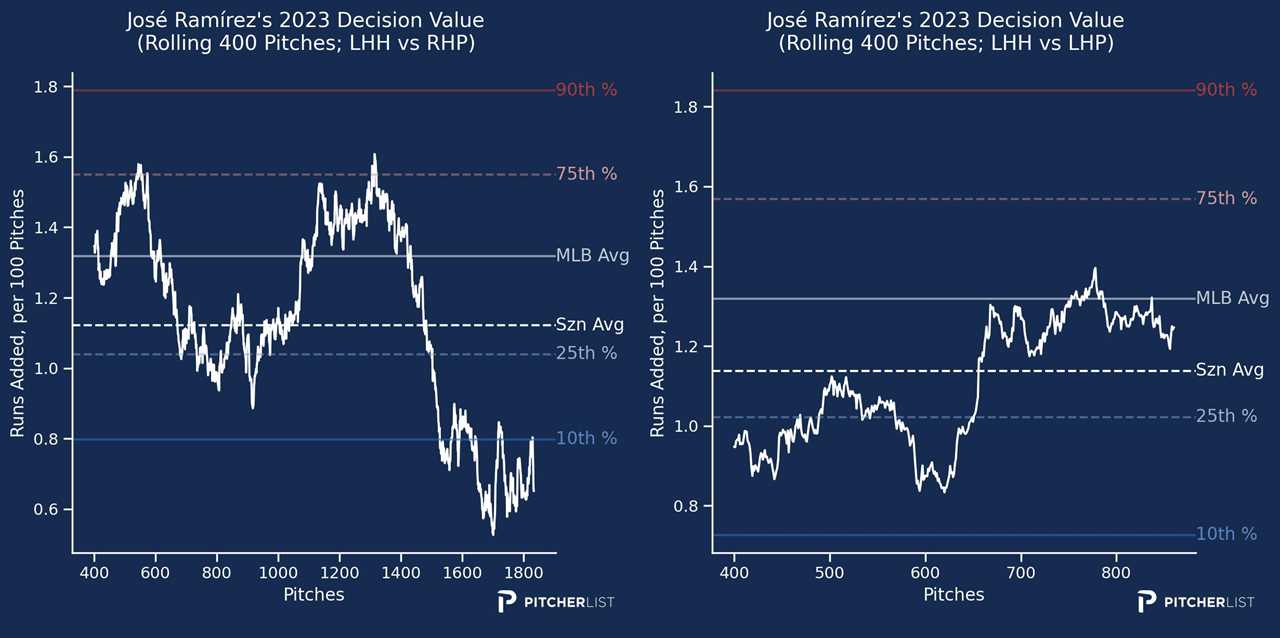
Throughout the season, those two lines seem to run counter to each other, with Ramírez making good decisions from one side and bad decisions from the other side. I don’t know where to begin untangling that one.
I’m afraid that’s where I’ll have to leave you. There’s a chicken-and-egg conversation to be had here. It’s possible that Ramírez adjusted his plate discipline because hits weren’t falling in, because of doubts about his hand, because he wasn’t hitting the ball as hard, or because of some other factor we can’t guess at. It’s also possible that this is just the kind of thing that happens, and the injury is a convenient place to assign the blame. There’s no real way to know, and as soon as Ramírez hit that hot stretch in early June, he went back to his standard, more judicious approach.
In the end, unless you’re digging into the underlying metrics, you’ll see only another vintage José Ramírez season. By DRC+, which looks at underlying metrics and not just results, he was at 133, the third-best season of his entire career. As it stands, there’s no reason that we shouldn’t expect him to put up another ho-hum, five-win season in 2024. Still, we should probably pay a little more attention to it, just in case.
Source
https://blogs.fangraphs.com/jose-ramirez-was-totally-different-and-exactly-the-same-in-2023/
