Ron Chenoy-USA TODAY Sports
The Colorado Rockies are a bit of a laughingstock at the moment. I say this intending no undue disrespect; from a player evaluation and roster-building standpoint, they’re one of the handful of organizations in baseball that doesn’t meet the bare standard of competence. They’ve missed the playoffs five years running and lost 197 games over the past two seasons.
Unfortunately, this fallow period is the historical norm in Colorado. The Rockies strung together a pair of surprising playoff appearances in 2017 and 2018; apart from those two campaigns, which netted a total of one playoff win, the Rockies haven’t finished over .500 since 2010. In 31 seasons, they’ve never won the NL West.
And there isn’t really an end in sight. No Orioles-style bumper crop of prospects that can turn 100 losses to 100 wins in 18 months. Our playoff odds didn’t give the Rockies the dreaded goose egg, but it came down to the wire. The Rockies are projected to go 63-99, with a 0.1% chance of making the postseason. Both numbers are the worst in baseball. The projected 31-game gap to first place isn’t the largest in the league, if only because the Nationals are just as bad and the computers see the Braves as better than the Dodgers. (So do I, Ohtani and all, for what it’s worth.)
In spite of all this gloominess, I have great affection for the Rockies as a franchise. Their roster isn’t very good, but it’s heavy on players I like: Justin Lawrence, Kris Bryant, Brenton Doyle, and so on. The Rockies have great uniforms and a pretty ballpark, making them — in my estimation — a top-three aesthetic franchise in the sport. And I’m faintly obsessed with one of the franchise’s foundational millstones: How do you build a winning pitching staff in Denver’s thin air?
I don’t like that the Rockies are probably going to finish in last place, but on paper, they’re clearly the worst team in a highly competitive division.
We live in a golden age of people ignoring the laws of probability because the odds don’t line up with their worldview. This is largely to our detriment. But in this narrow case, that outlook could be useful.
When you don’t like what the numbers say, go get different numbers.
So I went to Dan Szymborski, the guy who makes numbers. Out of the entire FanGraphs family, Dan is the one who spends the most time getting yelled at on social media. And to be honest, he only deserves some of the abuse he takes.
See, the ZiPS projections that you see on our standings and player pages and so forth represent a 50th percentile projection. In reality, Dan boots up his Mike-from-The Moon Is a Harsh Mistress-style supercomputer and simulates millions of seasons. What you see is only the median outcome. By definition, some — even most — players and teams will either noticeably over- or underperform their median projection. But other projections are available.
Surely that ugly number didn’t represent the entire range of outcomes. So I asked Dan for something a bit more optimistic. He simulated the 2024 season five million times. (“Watching the 2024 Rockies play baseball for five million years sounds like one of the scarier depictions of punishment in the afterlife,” he said.) The 90th-percentile outcome for the Rockies was 79 wins. The 95th-percentile outcome was 82 wins.
I’ll be completely honest with you, that’s worse than I had feared. Not even once out of 20 simulations did the Rockies get to a record that would’ve made the playoffs last year. In 2023, 84 wins was the minimum buy-in for a playoff spot. Since 2017, only one team has won its division by winning fewer than 90 games in a 162-game season. Both the 84-win Diamondbacks last year and the 88-win Braves in 2021 won the pennant, so we’ll assume that just getting in is enough.
So let’s zoom out and see the whole distribution, which ranges from a minimum of 31 wins (be honest, you’d be interested in seeing this happen) to a maximum of 107:
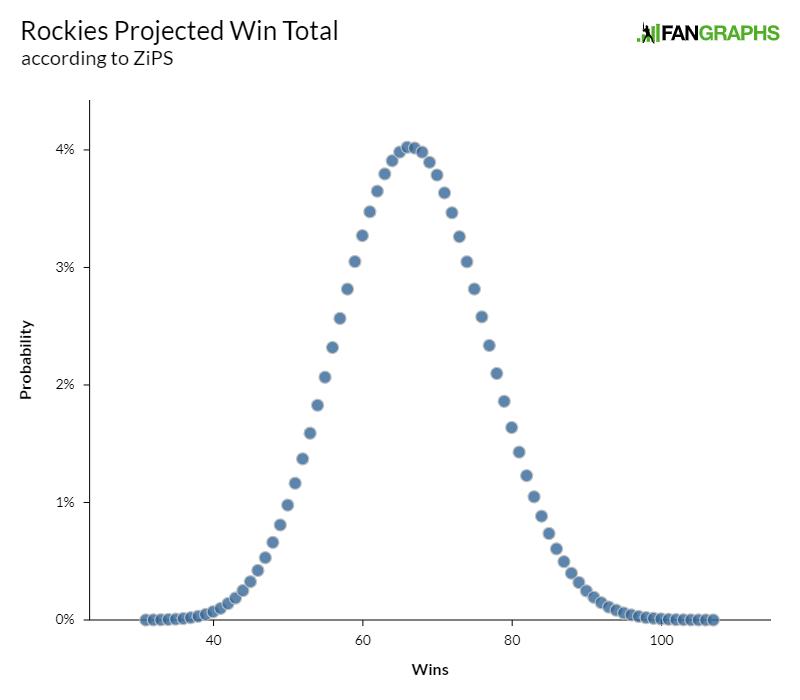
So the Rockies have a 3.53% chance of winning at least 84 games, a 1.29% chance of winning 88, a 0.72% chance of winning 90, and a 0.01% chance of winning 100. Now we’re getting somewhere.
What would it look like if it actually happened?
Eight years ago — eight years ago this week, actually — I was faced with a situation similar to this while working at Baseball Prospectus. We were promoting that season’s PECOTA projections, and feeling arch and cheeky as ever, I decided to conjure a scenario in which the Phillies — whom PECOTA projected to win 65 games that year, lowest in baseball — could win 104 games and the division title.
In order to do that, I took the 90th-percentile projection for every player on the likely Opening Day roster, plus a couple big prospects, and totaled up the new stats. The likelihood of any one of those players having such success was one in 10. The likelihood of all 27 players on my list doing so was one in a number so incomprehensibly large I could not come up with a suitable illustration at the time.
I’ve found one since. Ten meters is roughly the height of a three-story building; 1027 meters is more than 100 billion light years, which is greater than the diameter of the observable universe.
But one chance in 1027 is not zero. So let’s roll with it and do the same thing with the Rockies’ 90th-percentile ZiPS projections, which Dan was once again gracious enough to provide me with. Actually 1038 this time, because I roped in a bigger base roster:
Rockies Position Players ZiPS Projections
Don’t worry too much about the WAR totals, since they’re dependent on playing time. For that, I used the projected plate appearances from the RosterResource depth charts.
What does this once-in-a-cosmology season look like? Well, some of it seems pretty attainable. Bryant and Charlie Blackmon turn back the clock. Brendan Rodgers gets healthy. Nolan Jones, who’s going to be really good even in this universe, turns into a monster. The Mecha-Rockies don’t even need Doyle to be a league-average hitter!
Let’s turn the page to the pitchers:
Rockies Pitcher ZiPS Projections
Even in the 90th-percentile world, not a single starter with an ERA under 4.00, nor a single reliever with an ERA under 3.30. I am bereft at the smallness of our dreams.
If literally everything goes right for the Rockies, and we end up in the far right tail of that win total graph, this is what it’ll look like. And unless they actually make it to that one-in-five million 107-win season, they’d probably need the Giants and Diamondbacks to underperform, and the five or six best players on the Dodgers to give up baseball and start a jam band.
But again, it could happen. Let’s ship Mookie Betts a pair of Birkenstocks and a guitar. Anything is possible.
Source
https://blogs.fangraphs.com/okay-but-seriously-what-if-the-rockies-made-the-playoffs/
