
Gary A. Vasquez-USA TODAY Sports
I imagine that everybody here at FanGraphs generates ideas for articles in different ways. Looking at leaderboards is certainly a common method. You click around, sorting by different stats until someone looks out of place. “How did you get all the way up here?” is what the start of a FanGraphs article sounds like. Sometimes ideas take longer to germinate, and sometimes there are twists and turns along the way.
For a while now, I’ve been noticing that Freddie Freeman always seems to pop up near the top of Baseball Savant’s foul ball leaderboard. He finished second to Ozzie Albies in 2023 and second to Bo Bichette in 2022. In 2021, he finished third behind both Bichette and Albies. He finished third again in 2020 and first in 2019, 2018, and 2016. Freeman is one of the best hitters in the game, and since 2016, he has 4,225 foul balls, over 400 more than Francisco Lindor in second place. The names below them are good too: José Abreu, José Ramírez, Marcus Semien, Paul Goldschmidt. You get the picture. That brought me to my first question:
Are foul balls the mark of a good hitter?
However, I didn’t investigate this question immediately. The leaderboards for most batting counting stats are going to include good players who come to the plate a lot. All of those guys at this top of the list are known for being in the lineup everyday. I suspected that it was mostly noise, and I set it aside.
Last week, I was once again looking at Baseball Savant, and I happened to notice that the foul ball rate has been rising since the beginning of the pitch-tracking era. In search of a bigger sample size, I checked our numbers too. We don’t keep track of foul balls here, but we have information from Sports Info Solutions on the individual pitch level dating back to 2002, so I did my best to pull foul rates from those numbers. For anyone who’s interested:
Total Pitches x Swing% x Contact% = Pitches Contacted
At-Bats – Strikeouts + Sacrifices = Balls In Play
Pitches Contacted – Balls In Play = Foul Balls
That’s definitely not a perfect formula and it doesn’t match Statcast exactly, but it’s close enough to confirm that the overall trend didn’t magically start in 2008.
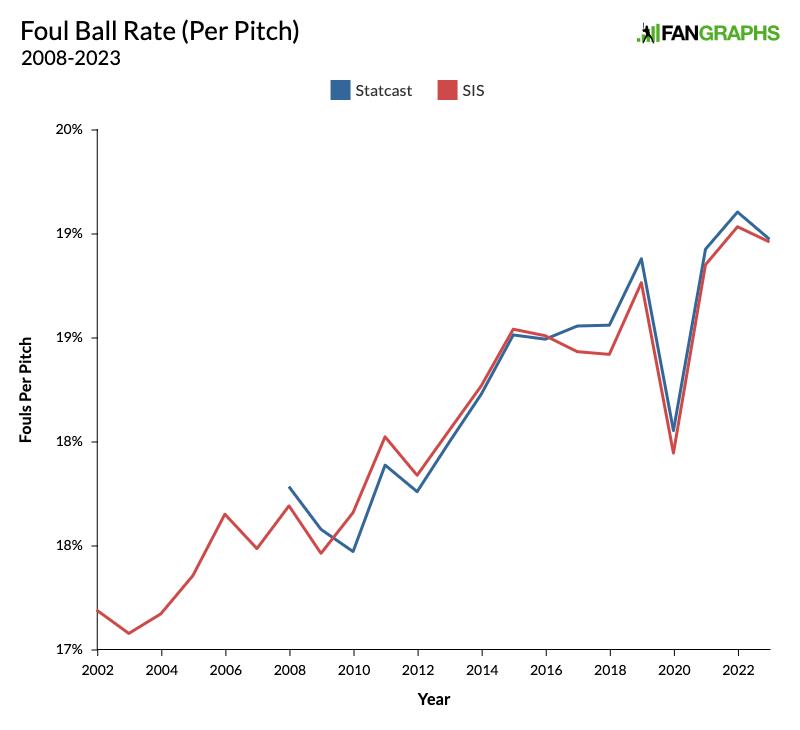
In the last 21 years, the foul ball rate has risen by roughly two percentage points. That’s roughly five extra foul balls per game. That brought me to question two:
Why are there more foul balls today?
That question seemed interesting enough for me to start digging. In order to investigate it, I decided to look at things on a per-swing basis rather than a per-pitch basis. The graph below shows the three outcomes that can happen on any swing: putting the ball in play, fouling it off, and whiffing.
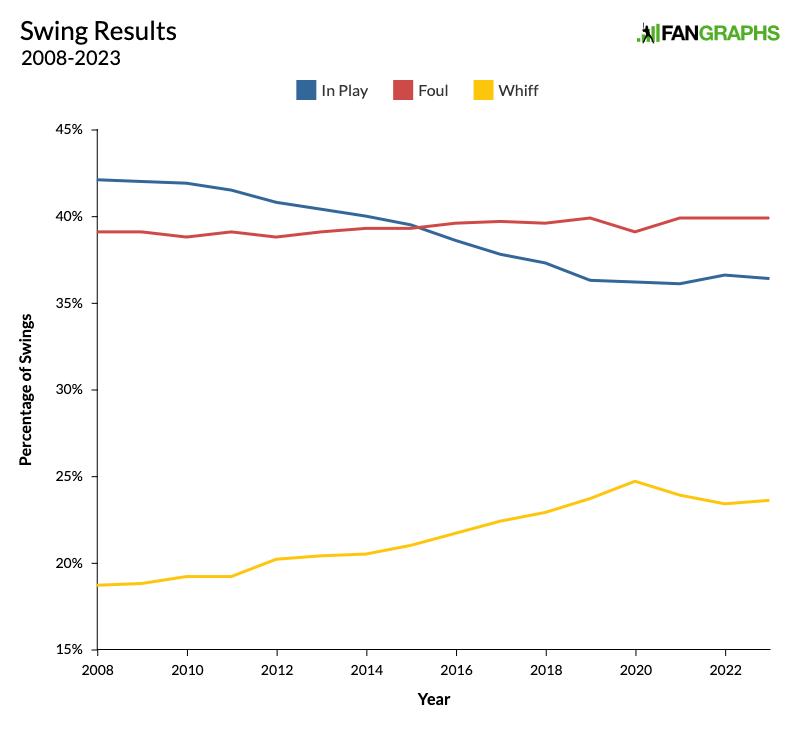
That red line has barely gone up, and it’s not just because the scale of the graph is bigger. The foul rate hasn’t actually risen by two percentage points. Overall swing rates have risen by nearly three percentage points, and naturally, if batters are swinging more, they’re going to foul off more pitches. On a per-swing basis, batters are still fouling more pitches off, but the difference over the past 16 years is closer to 0.8 percentage points. Still, the shape of the graph left me even more intrigued.
Whiff rate has risen a whole lot and BIP rate has fallen a commensurate amount. At the same time, foul rate has crept up ever so slightly. The thing that really caught my eye was the anomaly in the graph. In the 60-game 2020 season, there’s a big spike in whiff rate and a commensurate drop in foul rate, but in-play rate doesn’t change at all. Somehow, there were a bunch more whiffs, but all of them came out of the foul ball rate and none came out of the in-play rate. This brought me to the third question, and it’s the most interesting one yet:
What is a foul ball?
Or if we want to be more specific:
Should we think of a foul ball as a pitch that was nearly put into play, or as a pitch that was nearly missed altogether?
I realize that this question is bringing us into George Carlin territory. I also know that Baseball Savant will at some point be releasing the kind of bat tracking data that could very well make some of what you’re about to read obsolete. However, let’s say you’re gearing up for a swing and you don’t make solid contact. Maybe you completely swing over a curveball or you’re way behind a high four-seamer. You could miss by as much as a couple feet. Alternatively, you could just barely miss your pitch, fouling it straight back or ripping it just a few inches wide of the foul line. Every foul ball falls somewhere between these two extremes. I guess I had always generally thought of fouls as pitches that were almost put in play. After all, the batter might not have squared the ball up, but they still managed to get a piece of it rather than miss it entirely. That may yet be true, but on a league-wide level, over the past 16 years, more whiffs have come with more foul balls.
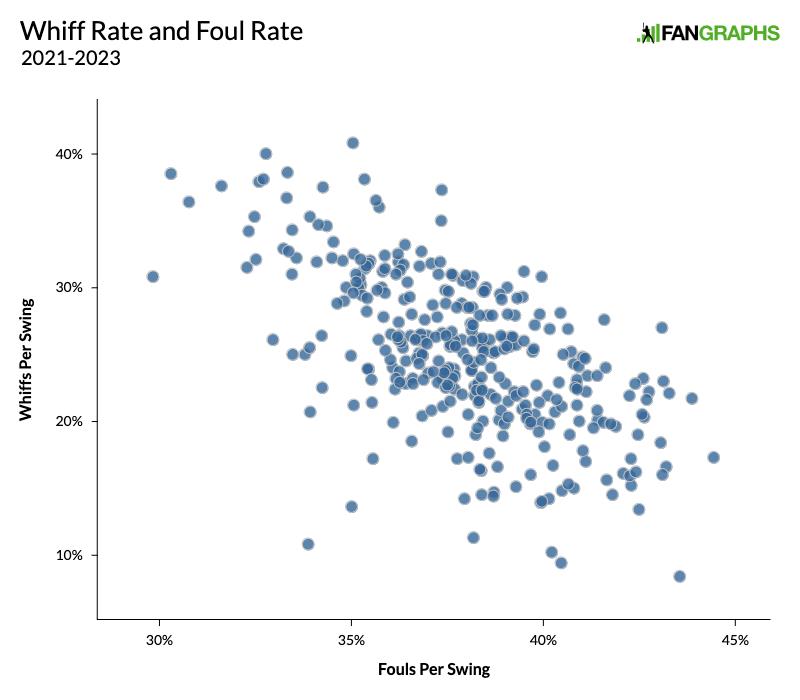
Here’s where things get tricky. On an individual level, it goes in the opposite direction: More whiffs come with fewer foul balls. I pulled data for every player who has seen at least 2,500 pitches over the last three seasons, leaving me with a sample of 338 players. On a per-swing basis, the correlation coefficient between a player’s foul rate and their in-play rate is .21. The correlation to whiff rate is -.62, much stronger, but also negative. More contact means more foul balls.
That brings us back to our first question. If fouling the ball off means whiffing less, do good hitters foul off more pitches? The answer is: maybe just a little bit. On a per-pitch basis, fouling off more pitches is weakly correlated with a lower wOBA (R = -.11), simply because players with poor plate discipline drive up the numbers. If you chase too much, you’ll rack up foul balls simply by virtue of swinging so often. On a per-swing basis, a higher foul rate is associated with a higher wOBA. That’s a yes! But the correlation is even weaker (R = .09), and if you look at xwOBA, the correlation drops to .01.
Foul rate may not tell us that much about the overall quality of a hitter, but it does tell us a lot about the kind of hitter they are. For batters, I found that fouling off more balls is correlated with a higher batting average (R = .20), and lower ISO (R = -.18), and exit velocity (R = -.26). Sluggers with big swings and big whiff rates hit fewer foul balls. When they miss, they miss big. Players with great bat control who hit for high averages also foul off more pitches. They frequently manage to put the bat on the ball, even if they don’t always make solid contact when they connect. That could even explain the gap between the correlations in wOBA and xwOBA. Maybe players with great bat control, the ones who can fight off tough pitches rather than miss them entirely, are also more adept at placing the ball where they want, beating the defensive alignment by rolling a grounder through the hole. That part’s just a guess, but so far all of this is fairly intuitive.
Still, that brings us back to our second question? Why is the foul rate rising, especially considering the fact that the league has been trending toward more power and more whiffs? Shouldn’t today’s player, who makes less contact and hits for more power, be fouling off fewer pitches? That’s when I realized I was looking at the graph the wrong way. In 2021, Devan Fink looked at things from the pitcher’s perspective and found that whiff rate predicted strikeout rate pretty well, but it predicted it even better if you also included foul rate. To answer this question about batters, I shouldn’t have been looking at foul rate and in-play rate in the context of swings. I should have been looking at them in the context of contact.
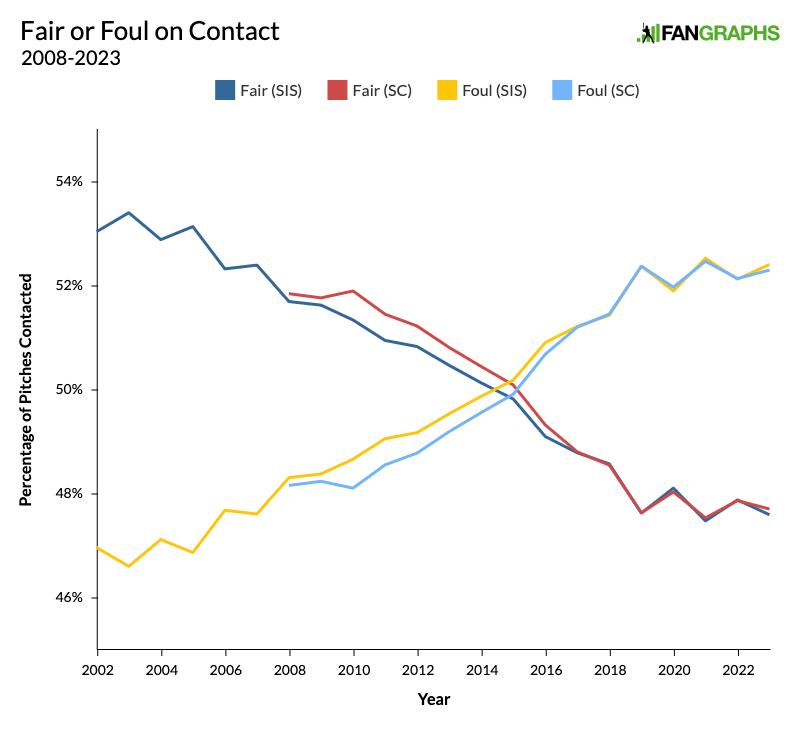
For as far back as we can measure, when batters have made contact, the percentage of that contact that has resulted in fair balls has been falling. And that makes perfect sense in the context of rising whiff rates. It’s become harder to make contact at all, and the game has continued to select for players who swing harder and miss bigger. Naturally, even when players do make contact, they’re more likely to make the kind of imprecise contact that results in foul balls.
That brings us back to question number three: Is a foul ball a pitch that was almost put into play or a pitch that was almost missed entirely? The answer is always somewhere between the two, and as this graph indicates, the answer is also a moving target. It’s changed over time. According to the graph above, even when a batter does make contact, they’re 12% more likely to foul the ball off than they were 22 years ago. That probably also means that a foul ball has never been closer to a whiff than it is today.
Source
https://blogs.fangraphs.com/what-is-a-foul-ball-anyway/
