Nick Turchiaro-USA TODAY Sports
Here’s an undeniable truth: Your performance matters most in the biggest spots. It sounds silly to write that, in fact. It’s so obviously true. I’m not just talking about professional sports, or even just sports. No one cares if you nailed your violin solo in your basement when you were practicing it Tuesday evening; they care whether you fumbled the chord progression in Thursday’s big recital.
That self-evident truth has led to decades of squabbling over baseball performances. It’s incontrovertibly true – and yet it seems that players don’t have a lot of control over when they have their best performances. If you want to start an annoying discussion with your uncle (not my uncle, hi Roy, but your generic back-in-my-day uncle), just talk about RBIs or pitcher wins and say something about clutch. You won’t thank me, because just imagining that discussion is giving me anxiety, but you’ll certainly prove my point.
What if we could find a place where players can control their best performance, though? There’s one place in baseball that follows an orderly progression of leverage: the count. The first pitch of an at-bat just matters less, on average, than one thrown with two strikes. That’s true regardless of who’s at bat, regardless of who’s pitching, and regardless of the game situation.
What’s more, there’s an easy way that pitchers can change their performance, and it’s largely in their control. They don’t throw every single pitch the exact same; that would be flatly impossible. Some of the variation in pitch shape is inevitable, caused by minute differences and grip or infinitesimally different release points. But velocity? Pitchers can mostly control that.
Throwing harder in two-strike counts is an obvious solution to the two-strike situation. Batters are more likely to swing, so getting the ball by them is more important. And since they’re more likely to swing, even if more velocity comes at the expense of command, a pitch that misses the zone by a bit has a better chance of working out for the pitcher anyway. It all stacks together to favor muscling up for two-strike counts in particular, and pitchers have responded accordingly. Out of 170 pitchers who threw either a sinker or four-seamer at least 150 times in two-strike counts last season, 169 increased their velocity relative to how fast they threw the pitch in all other counts. The lone holdout was Marcus Stroman, whose velo declined by a measly 0.1 mph.
The king of this approach? Kevin Gausman, who added a whopping 1.7 mph when the count struck two strikes. He averaged 95.9 mph in those situations and 94.2 in all others. It paid off handsomely for him. Gausman’s fastball was absolutely lethal in two-strike counts. His swinging strike rate increased from 8.7% to 13.8%, and all told he turned the pitch into a strikeout 24.6% of the time, the third-best mark in baseball for a four-seamer. Even when hitters put the ball in play, he limited them to below-average marks for wOBA, xwOBA, barrel rate, whatever statistic you’d prefer.
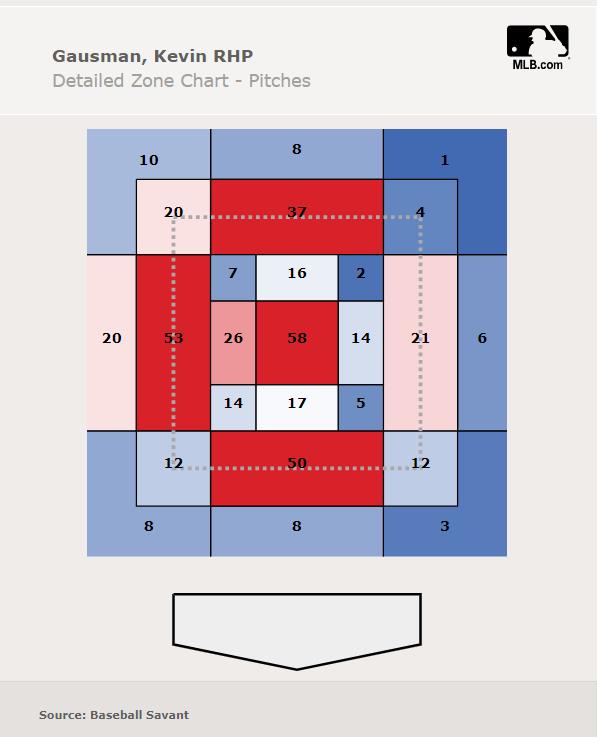
All told, per Baseball Savant, Gausman’s two-strike fastballs generated 16.1 runs worth of value relative to an average pitcher. That was the best mark in baseball, both overall and on a per-pitch basis. Wondering why Gausman put opposing hitters away in two-strike counts at the sixth-best rate in the majors and allowed the lowest wOBA and xwOBA in those situations overall? It’s because he dialed up his fastball and dominated. It wasn’t a matter of location, either, because the most frequent place he put the ball was right down the pipe:

It feels like there’s a lesson to be learned here: Throw harder when you get ahead and prosper. That reminded me of an excellent Stephen Brown article from this offseason that looked into whether pitchers who lose a bit of velocity on a specific pitch do worse. The conclusion of that article was that most of that effect was tied up in the count; pitchers simply pitched differently, velocity-wise, depending on count.
So should everyone just be like Gausman and dial up a monstrous heater whenever they have a chance for a strikeout? They kind of already do; on average, pitchers increase fastball velocity in two-strike counts by roughly 0.7 mph. And yet, oddly, none of it seems to matter, at least to the best of our ability to measure outcomes.
A quick refresher on run value is in order here, but if you already know the gist of it, you can skip this section. We and Baseball Savant both calculate run value with a delta method. We look at the expected result of a plate appearance before a pitch and then again after that same pitch. The difference is the run value of that particular pitch.
An easy way of thinking about it: After reaching a 1-2 count, hitters produced a .227 wOBA in 2023. After reaching a 2-2 count, they improved to a .275 wOBA. Throwing a ball in a 1-2 count, then, costs pitchers an expected 48 points of wOBA, or 0.04 runs. On the other hand, getting a strikeout reduces the batter’s wOBA to a flat zero, of course, an improvement of 227 points of wOBA or 0.19 runs. Balls in play fit into this model quite well, because we know the wOBA values of each ball-in-play outcome. By using this method, you can assign a value to every single pitch thrown in the majors. There are minor differences between our two methods – Savant accounts for base/out state in theirs, while we keep ours neutral – but the concept is very similar.
Here’s the weird part of all of this: Despite being thrown harder, two-strike fastballs aren’t producing better results relative to expectation. Major league pitchers threw 67,793 two-strike four-seamers in 2023 and lost 78.4 runs relative to expectation, a rate of -0.115 runs per 100 pitches. They threw 163,134 four-seamers in every other count, and lost 159.9 runs relative to expectation, a rate of -0.098 runs per 100 pitches. Those numbers are basically the same.
You might think that’s definitive, but there’s a confounding variable here that’s maddeningly tough to disentangle. How do we figure out average hitter performance after two-strike counts? By adding up what happened on all the pitches they faced. But if those pitches are just better in terms of raw stuff, average results will end up worse, naturally enough. And so comparing the population across counts doesn’t really work.
If that sounds unintuitive, consider an extreme example that will hopefully clear things up a little bit. Let’s say that every pitcher, for reasons unknown, has access to a secret ultimate pitch that gets hitters out 100% of the time, but that they can only throw it on one count, and even then only 50% of the time. Let’s say those pitchers all choose 2-2 counts. Now 2-2 counts are going to be extremely bad for hitters. If you threw a perfectly average fastball in an 0-0 count, it would show up as perfectly average. If you threw it in a 2-2 count, where half of the pitches are secret ultimate pitches, your fastball will do far worse than the average 2-2 pitch. It’s all a matter of comparisons.
OK, so we can’t compare these two-strike fastballs to other counts when it comes to pitch values. In fact, I don’t think we can compare them based on seemingly absolute outcome measurements like swinging strike rate or whiff percentage. That’s because hitters also change their behavior in two-strike counts. Short of using a stuff model, we’re just going to have to compare within two-strike counts to see what works and what doesn’t, because everything else is going to be extremely confused by selection bias.
With that said, here’s what I’d expect: The pitchers who, like Gausman, blaze their hardest fastballs in two-strike counts should do best. He added the most velocity and got the best outcomes in two-strike counts. The pitcher who added the least velocity on four-seamers (I excluded sinkers for this part of the analysis for a more straightforward comparison) was Jordan Lyles, and he was downright awful in 2023. He was particularly awful in two-strike counts, in fact; only Lance Lynn was worse. The narrative writes itself.
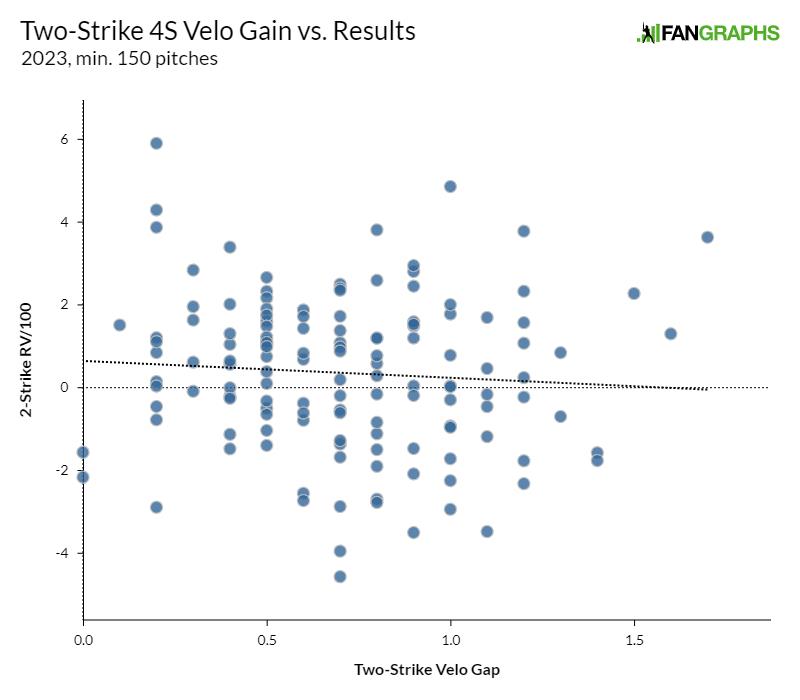
There’s just one problem: The data doesn’t match those two outliers. Sure, Gausman and Lyles are polar opposites with completely different results. The rest of the pitchers don’t really follow that pattern, though. The relationship between velocity increase for two-strike fastballs and run value for those fastballs is nonexistent:

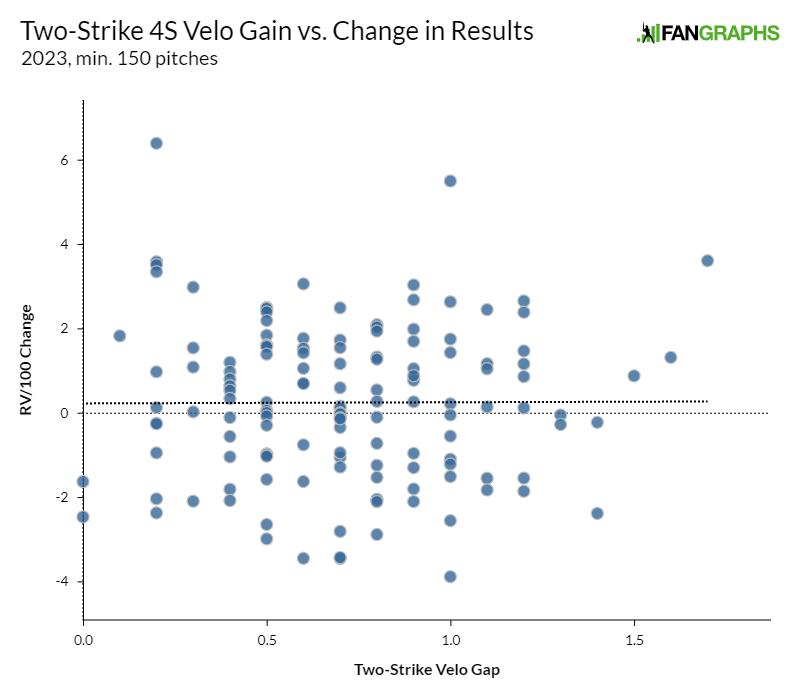
And even if you’re looking at relative value, how much better those fastballs perform in two-strike counts relative to how they perform overall, there’s nothing to see:

OK, fine, maybe we’re not picking something up by looking at the broad population of pitchers. But surely something that Gausman is specifically doing will stick out. He has this secret sauce for throwing harder and getting better results with two strikes, clearly. Or, well, maybe not so clearly. In 2022, 98 pitchers threw at least 200 two-strike four-seamers. Gausman’s results were the 95th-best. He was as bad in 2022, another dominant season, as he was good in 2023. In fact, he’s thrown harder with two strikes his entire career, but the results are all over the place:
Two-Strike Results
| Year |
2-Stk Velo |
Other Velo |
Gap |
2-Stk RV/100 |
Other RV/100 |
Gap |
| 2015 |
96.9 |
95.5 |
1.4 |
2.0 |
-0.7 |
2.7 |
| 2016 |
96.6 |
94.9 |
1.7 |
-0.2 |
1.0 |
-1.2 |
| 2017 |
96.2 |
94.5 |
1.7 |
-1.4 |
0.6 |
-2.0 |
| 2018 |
95.1 |
93.1 |
2.0 |
0.8 |
-0.7 |
1.5 |
| 2019 |
95.2 |
93.5 |
1.7 |
-2.0 |
-1.0 |
-1.0 |
| 2020 |
96.3 |
94.6 |
1.7 |
1.0 |
0.6 |
0.4 |
| 2021 |
95.7 |
94.2 |
1.5 |
-1.5 |
1.4 |
-2.9 |
| 2022 |
96.0 |
94.6 |
1.4 |
-2.5 |
1.1 |
-3.6 |
| 2023 |
95.9 |
94.2 |
1.7 |
3.6 |
0.0 |
3.6 |
All four-seam fastballs thrown in two-strike counts by Kevin Gausman, bucketed by year
What does this all mean? I’m certainly puzzled. I thought that Alex Chamberlain’s piece on command might hold the answer – Gausman was particularly good at locating the ball on the fringes of the plate in pitches that ended plate appearances in 2023. I shot out of bed this morning when I got to that part of his article and ran to my computer to finish this piece. But alas, even if I break his two-strike fastball results out by zone, 2022 and 2023 look radically different:
Results by Zone, 2022-2023
| Zone |
2022 RV/100 |
2023 RV/100 |
| Heart |
-4.3 |
5.3 |
| Shadow-In |
-1.2 |
8.7 |
| Shadow-Out |
-1.3 |
1.1 |
| Chase |
-0.9 |
-4.1 |
| Waste |
-4.9 |
-5.4 |
All four-seam fastballs thrown in two-strike counts by Kevin Gausman, bucketed by location
Even when he located in the best location you can imagine – the shadow-in zone, where called and swinging strikes are both frequent outcomes – he got below-average results in 2022. Then he got best-in-league results in 2023 with essentially the same pitches. He wasn’t benefiting from throwing his fastball less often in two-strike counts and ambushing hitters – its usage climbed from 37.3% to 44.6%.
At the end of the day, I think the takeaway here is that pitchers should do whatever helps them execute best. There appears to be little inherent value in adding a bit of extra velocity with two strikes, but I can’t even say that with confidence. It’s definitely the case that bigger velocity gaps aren’t associated with better outcomes, though. I used Gausman and Lyles as my examples in explaining this effect, but I could just as easily have used Kirby Yates (0.2 mph velocity increase, 6.4 RV/100 improvement in fastball results) and Shane McClanahan (1.4 mph velocity increase, 2.4 RV/100 decline in fastball results) and tried to convince you of the opposite.
The best way to pitch remains frustratingly hard to pin down. Sure, it’s true that all else equal, faster pitches are better. But it’s pretty clear that not all else is equal in this situation. You can succeed like Gausman or like Yates. You can fail like Lyles or (relatively speaking) like McClanahan. There’s no doubt in my mind that pitchers should throw their best pitches in two-strike counts. However, measuring who does that, and how much it helps them, remains impossibly tricky.
Source
https://blogs.fangraphs.com/all-gaus-no-brakes/
 Backyard GrillingWeekend WarriorsAdvice from DadBeard GroomingTV Shows for Guys4x4 Off-Road CarsMens FashionSports NewsAncient Archeology World NewsPrivacy PolicyTerms And Conditions
