Ron Chenoy-USA TODAY Sports
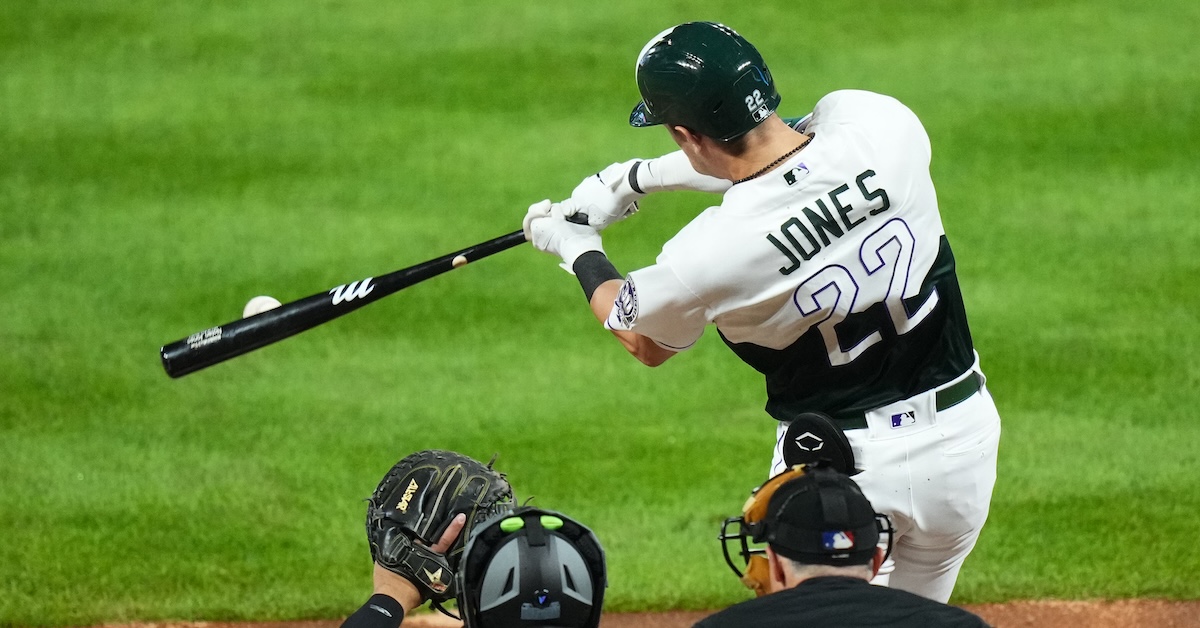
By most any measure, Rockies outfielder Nolan Jones had an excellent rookie season in 2023. He finished fourth in National League Rookie of the Year voting behind unanimous winner Corbin Carroll, Kodai Senga, and James Outman. He posted a .297/.389/.542 batting line in 106 games, becoming the first Rockie rookie to go 20-20 in franchise history. His .395 wOBA ranked 10th among the 212 players with at least 400 plate appearances. He was an above-average fielder, spending most of his time in the outfield corners, with his fairly poor range more than made up for by his elite arm (OAA, DRS, and UZR all agree that he was a plus defender). He led Colorado with 3.0 BsR, and finished as one of 12 players in the majors with as many as 3.0 runs above average in each of batting, base running, and fielding value:
Players With 3.0+ Runs of Batting, Base Running, and Fielding
By the end of the season, he had posted 3.7 WAR, the equivalent of 5.7 WAR per 162 games — good for 18th in the majors among players who played 100 or more games. Mile-high caveats aside, that’s a pretty spectacular debut:
MLB’s Best by WAR/162 in 2023
min. 100 Games
There’s one thing about Jones’ rookie year that stuck out to me in particular. His approach at the plate was rather successful overall — he hit fastballs and breaking pitches, hit for power and average, and drew walks — but his success on pitches in the shadow of the zone was unmatched across all of baseball. On pitches in Baseball Savant’s “shadow” zone, Jones generated 18.3 runs of value, the most of any hitter in the league. Luis Arraez was second with 17.0 runs, and beyond Arraez, no other hitter had more than Shohei Ohtani at 12.1. On a rate basis, Jones was even further removed from the pack — his 2.4 runs per 100 shadow pitches was trailed most closely by Arraez at 1.8, a full 25% lower.
What’s particularly curious about Jones’ success on the fringes of the strike zone is that he did a lot of that damage swinging. For most of the league, swinging at pitches on the edge didn’t go all that well — as a league, hitters were worth -3.3 runs per 100 pitches on swings at these pitches and just about zero on taken pitches. But for Jones, swinging at these pitches was much more fruitful — he generated 4.4 runs per 100 swings on shadow pitches, and just 0.7 per 100 takes. Jones had a remarkable .413 wOBA on pitches on the shadow of the plate — and that went up to .429 when he swung the bat:
Batting Runs/100 Pitches on the Shadow
| Swing/Take |
Jones |
League |
| Swing |
4.4 |
-3.3 |
| Take |
0.7 |
0.0 |
It’s an amazingly valuable skill, being able to control the outside edges of the strike zone like that. Stuck between the rock that is the heart of the plate and the hard place that is the chase zone, pitchers really have no choice but to continue to attack on the shadow, especially against a hitter like Jones who is a power threat over the heart and manages to avoid chasing at better-than-average rates. He does have some holes in the upper third of the strike zone, but a pitcher can only exploit that so much when there’s nowhere else to go. Jones appears to dominate the edges with the best of them, and that made him a far harder out in 2023.
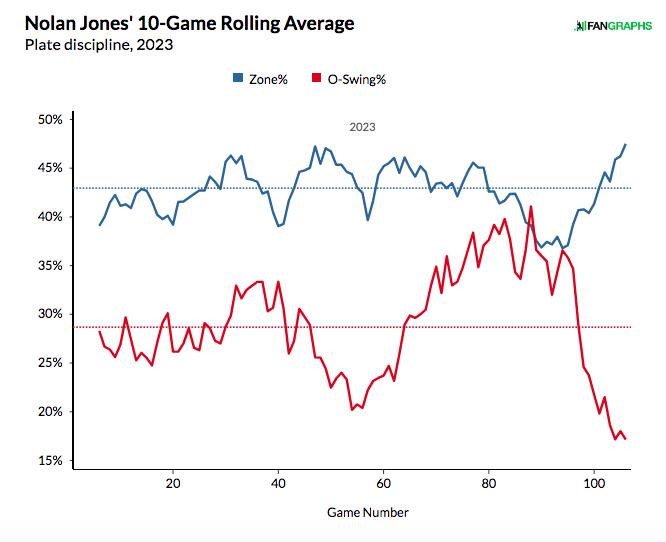
Towards the end of the season, pitchers strayed away from the strike zone. Jones countered that move with the best tool there is in that situation: patience. As Jones’ chase rate rose through the late summer, opposing pitchers attacked the strike zone less, and Jones was quick to adjust, with his chase rate quickly subsiding to season-low rates by the end of the year:

Jones’ success will always be met with some level of scrutiny because of where he plays, but he hit better on the road than he did at Coors Field, posting a .288/.380/.554 line with a 148 wRC+ in road games and a .306/.398/.530 with a 122 wRC+ in Colorado. He handled both righties and lefties, posting a 137 wRC+ vs. righties and a 130 wRC+ against same-handed pitchers. There was little that gave him trouble, with the exception of a three-week slump in July that he shook off with a strong August and a torrential September:
Nolan Jones Month-by-Month
| Monthly |
AVG |
OBP |
SLG |
wOBA |
wRC+ |
| May |
.278 |
.316 |
.556 |
.366 |
115 |
| June |
.322 |
.413 |
.522 |
.401 |
139 |
| July |
.193 |
.258 |
.404 |
.285 |
61 |
| August |
.281 |
.369 |
.521 |
.376 |
122 |
| Sept/Oct |
.349 |
.461 |
.651 |
.465 |
182 |
Now, it was a season where everything went right — and as great as that was for Jones in 2023, it does suggest some regression may be in store for 2024. Among players with 400 or more plate appearances, Jones’ .401 BABIP was the very highest in the league, 35% higher than the league average. He ranked 15th in baseball with a 22.2% HR/FB ratio, nearly 10 percentage points higher than the league rate. And his .395 wOBA well outperformed his .360 xwOBA, though a .360 xwOBA is nothing to sneeze at (he was virtually tied with José Ramírez). All of this signals some level of luck-fueled overperformance in 2023, but Jones had a strong enough season that even with some regression, he could be quite a strong performer in 2024 and beyond. Particularly if he can continue to have such good control over the edges of the plate.
Sure enough, Dan Szymborski’s ZiPS projection system has Jones slashing .277/.368/.488 with a .367 wOBA and 3.1 WAR in 552 plate appearances in 2024, a modest regression but a season that would make for a respectable sophomore campaign. ZiPS’ 80th-percentile projections gives us a glimpse of what a step forward might look like: .304/.394/.543 with a 139 OPS+ and 4.3 WAR. The 20th-percentile projection, meanwhile, offers the cautionary tale of a sophomore flop: .248/.340/.434 with a 101 OPS+ and 1.7 WAR.
Perhaps the biggest win from Jones’ 2023 campaign, his first in Colorado, was that he’s done more than enough to earn himself a starting job in 2024; health permitting, the coming year will give him a shot to get his first full season under his belt. He was a stronger outfielder than expected in 2023, giving him a surefire spot in a corner heading into this season and offering some positional certainty for the first time in his career. Whether he can duplicate his freshman season remains to be seen, but one thing we know: In Colorado, it’s all about Nolan once again.
Source
https://blogs.fangraphs.com/nolan-jones-shadow-king/
 Backyard GrillingWeekend WarriorsAdvice from DadBeard GroomingTV Shows for Guys4x4 Off-Road CarsMens FashionSports NewsAncient Archeology World NewsPrivacy PolicyTerms And Conditions
