
Nick Turchiaro-USA TODAY Sports
The other day, my friend asked me a simple baseball question with no easy answer: What does a four-seam fastball look like? Not what is a four-seam fastball, or what does a four-seam fastball accomplish, or any number of fastball-related questions with more straightforward answers. He wanted me to conjure up an image of the most common pitch in baseball. I didn’t quite know what to tell him; strangely enough, the more ordinary something is, the harder it can be to describe.
My friend is merely a rhetorical device, but I’ve already grown attached to him, so let’s call him Tony. Tony is a casual observer of baseball. He hears terms like “fastball” and “curveball” and “the Dodgers are ruining the game” every now and then, but he doesn’t have the requisite context to understand what any of it really means. How do I show Tony what a four-seam fastball looks like in 2023? After all, every pitcher works differently. The velocity gap between Jhoan Duran’s and Rich Hill’s four-seam fastballs is the difference between a speeding ticket and losing your license. Explaining to Tony that those two offerings are technically the same pitch would be like trying to convince an alien that a Bergamasco Shepherd and a Xoloitzcuintli are the same species. It’s factually correct, yet without hyper-specific evidence – and the background knowledge necessary to interpret that evidence – it’s all but impossible to believe.
I could show Tony some video of Félix Bautista to illustrate the ideal four-seam fastball. Alternatively, I could show him Andrew Heaney as an example of a perfectly average four-seamer instead:
Andrew Heaney’s Four-Seam Fast-Blah
| Year |
Usage |
Run Value |
RV/100 |
Pitching+ |
| 2023 |
57.9% |
1 |
0.0 |
99 |
| 2022 |
62.5% |
0 |
0.0 |
101 |
| 2021 |
57.4% |
0 |
0.0 |
103 |
Run value and pitch usage via Baseball Savant
Yet Tony didn’t ask about results, be they average or exceptional. He wants a visual point of reference, and simply put, neither of those two throws a visually conventional heater. Reaching triple-digits on the radar gun remains a rarity, and Bautista does it more often than most. Meanwhile, Heaney throws his fastball with over 15 inches of arm-side run; that’s 70% more horizontal movement than the average four-seamer of a similar speed and release point. On the graph below, Heaney sits way over on the right, and only two dots (min. 500 pitches) can be found farther in that direction:
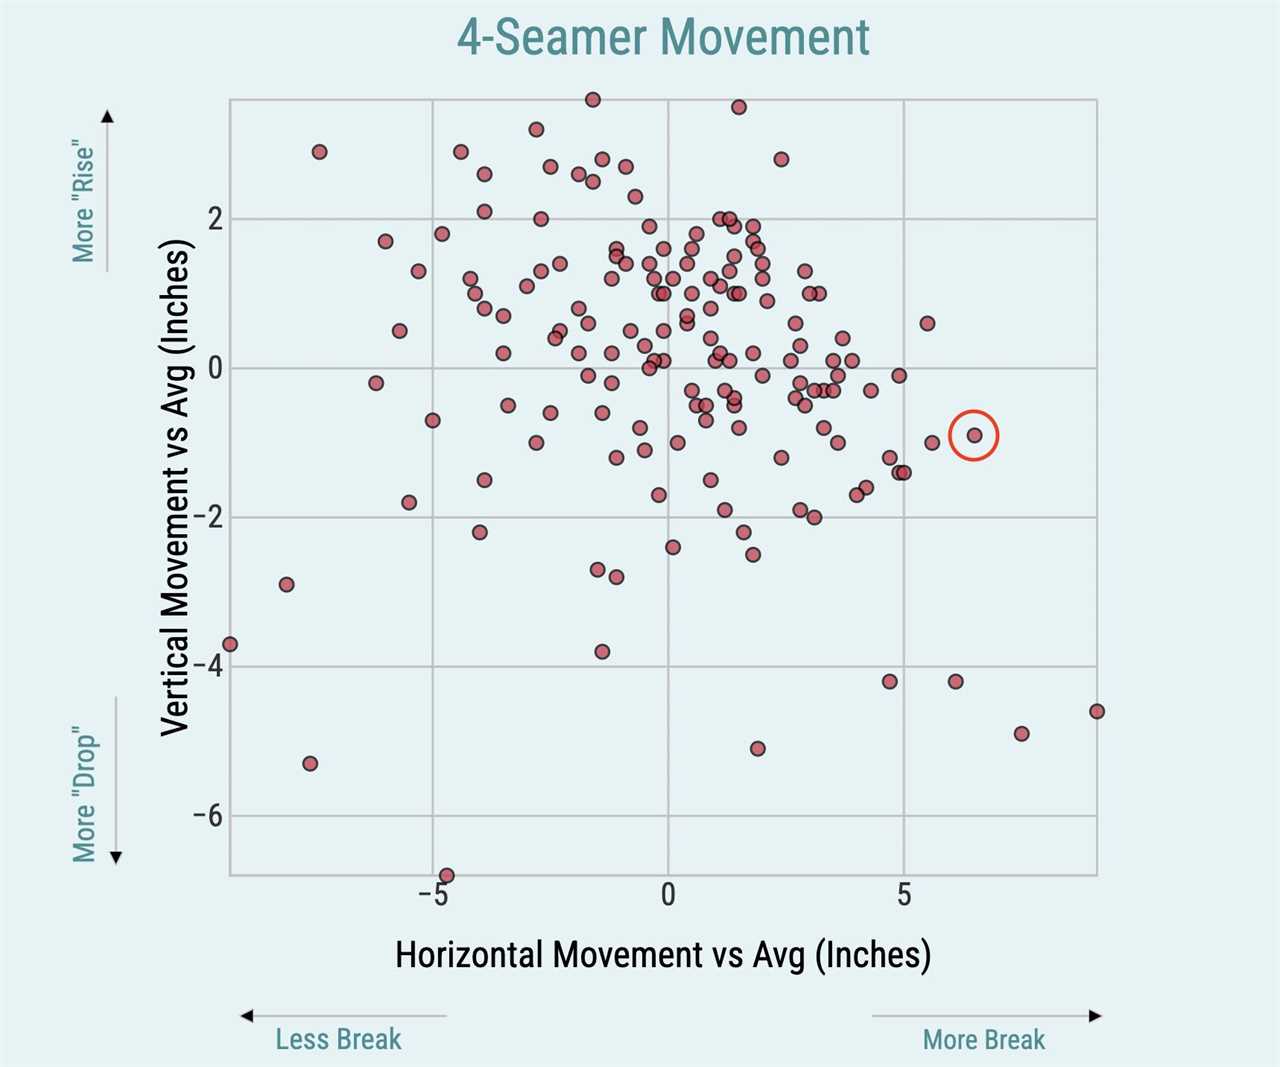
via Baseball Savant
What Tony really wants to see is the prototypical four-seam fastball, the pitch that most closely resembles the norm in as many material ways as possible. Identifying the man who throws such a pitch won’t serve a practical purpose; it won’t help teams win ballgames, fans win their roto league, or Harold Ramírez lay off all those four-seamers outside the zone. Still, it’s nice to have a baseline for the most important pitch in baseball – or any pitch for that matter. Thus, I set out to find the pitchers who throw the pitches that best exemplify what each pitch looks like in the game today.
A project like this requires a good deal of subjective decision making. No one throws a pitch perfectly identical to league average in every measurable way. Heck, even if someone did, who’s to say that average is the same as normal. The league average four-seam fastball last year clocked in at 94.2 mph, but the average reliever threw nearly a full mile per hour faster than the average starter. With that in mind, would it be incorrect to say that a starter who boasts a 94.2 mph heater is throwing with typical velocity? On top of that, pitchers who throw harder fastballs tend to throw better fastballs, which means they get to throw more fastballs. Therefore, they influence the league average to a greater extent than their less prolific peers. The average velocity of the 43 starters who threw at least 1,000 four-seam fastballs last season was 1.2 mph faster than the average velocity of the 216 starters who threw between 50 and 999 of the same pitch. Should those fewer, faster pitchers have such an outsized influence on the overall numbers? With all that said, I’m sticking with league average as my baseline (for lack of a perfect alternative, if nothing else), and I hope you’ll stick with me as I explain the rest of my decisions.
Next, I had to figure out how to narrow down the list of possible candidates. Seven-hundred and thirty-one players threw a four-seam fastball in the major leagues last year, and I wasn’t going to get anywhere if I gave each of them a close look. (Sorry Tony, even I have my limits.) Thus, I set 100 four-seam fastballs as my arbitrary minimum requirement, and I chose to prioritize one attribute above all else: velocity. It’s called a fastball, after all.
Seven pitchers (min. 100 pitches) averaged exactly 94.2 mph on their four-seam fastball. Another 18 sat at 94.1 or 94.3 mph, and I included those arms in my search to allow for candidates who might be a rounding error away from league average. That gave me 25 pitchers to work with, 19 right-handers and 6 southpaws. I hemmed and hawed over whether to include lefties at all, and ultimately I put off making a decision in hopes I wouldn’t have to. Thankfully, that proved to be the case, as none of the top candidates were left-handed.
Narrowing Down the Candidates
SOURCE: Baseball Savant
Armed with 25 contenders and a Google spreadsheet, I hopped on Baseball Savant, looking for as many physical pitch characteristics as I could find and manipulate. I settled on nine: vertical release point, horizontal release point, extension, perceived velocity, vertical movement, horizontal movement, spin rate, total movement, and active spin. After calculating the standard deviation of each metric, I returned to my 25 candidates. Did anyone fall within one standard deviation of league average in every category?
Well Tony, today is your lucky day. One pitcher, and only one pitcher, fit the bill. One pitcher was within a single standard deviation of league average in all nine of the aforementioned metrics. That same pitcher came within half a standard deviation in seven categories, within a quarter of a standard deviation in five categories, and within an eighth of a standard deviation in four. No one else came closer at any step along the way. The owner of the most ordinary four-seam fastball in baseball is José Berríos.
Wow… Let’s take a minute to marvel at the regularity. Here’s how Berríos threw his four-seamer in 2023:
José Berríos Four-Seam Fastball
| mph |
V Release |
H Release |
Ext. |
Pcvd. Velo |
V Mvt. |
H Mvt. |
Spin |
Total Mvt. |
Active Spin |
| 94.3 |
5.68 |
-2.30 |
6.5 |
94.5 |
0.1 |
1.3 |
2227 |
17.8 |
92% |
SOURCE: Baseball Savant
And here is how he stacks up to Alec Marsh, the next closest competitor and, as I discovered, a player for the Royals, not the title of a Phillies day care fan fiction. I’ve also included league average numbers in the table for additional context:
Berríos and Marsh Four-Seamers
| Pitcher |
mph |
V Release |
H Release |
Ext. |
Pcvd. Velo |
V Mvt. |
H Mvt. |
Spin |
Total Mvt. |
Active Spin |
| Berríos |
94.3 |
5.68 |
-2.30 |
6.5 |
94.5 |
0.1 |
1.3 |
2227 |
17.8 |
92% |
| Marsh |
94.2 |
5.67 |
-2.33 |
6.4 |
94.5 |
-0.3 |
1.2 |
2461 |
17.3 |
85% |
SOURCE: Baseball Savant
*Horizontal release point average for RHP
**Average is a close approximation using available data
I considered making a case for Marsh on the basis of speed alone. At the beginning of my search, I said I would prioritize velocity, and his 94.2 mph average was right on the money. However, Berríos’s 94.3 mph average velocity was actually rounded up from 94.25 mph. In other words, if he had thrown just one additional fastball at 92.3 mph or slower (he threw 27 such pitches last year), his season average would have fallen to 94.2. It’s simply too close to take the title away from him.
Interestingly, Berríos’s four-seam fastball wasn’t quite so ordinary until this past season. For most of his career, he threw the pitch with less rise and more run than the typical four-seamer. However, in 2023, his four-seamer had more vertical movement and less horizontal movement than it had since his breakout campaign in 2018:
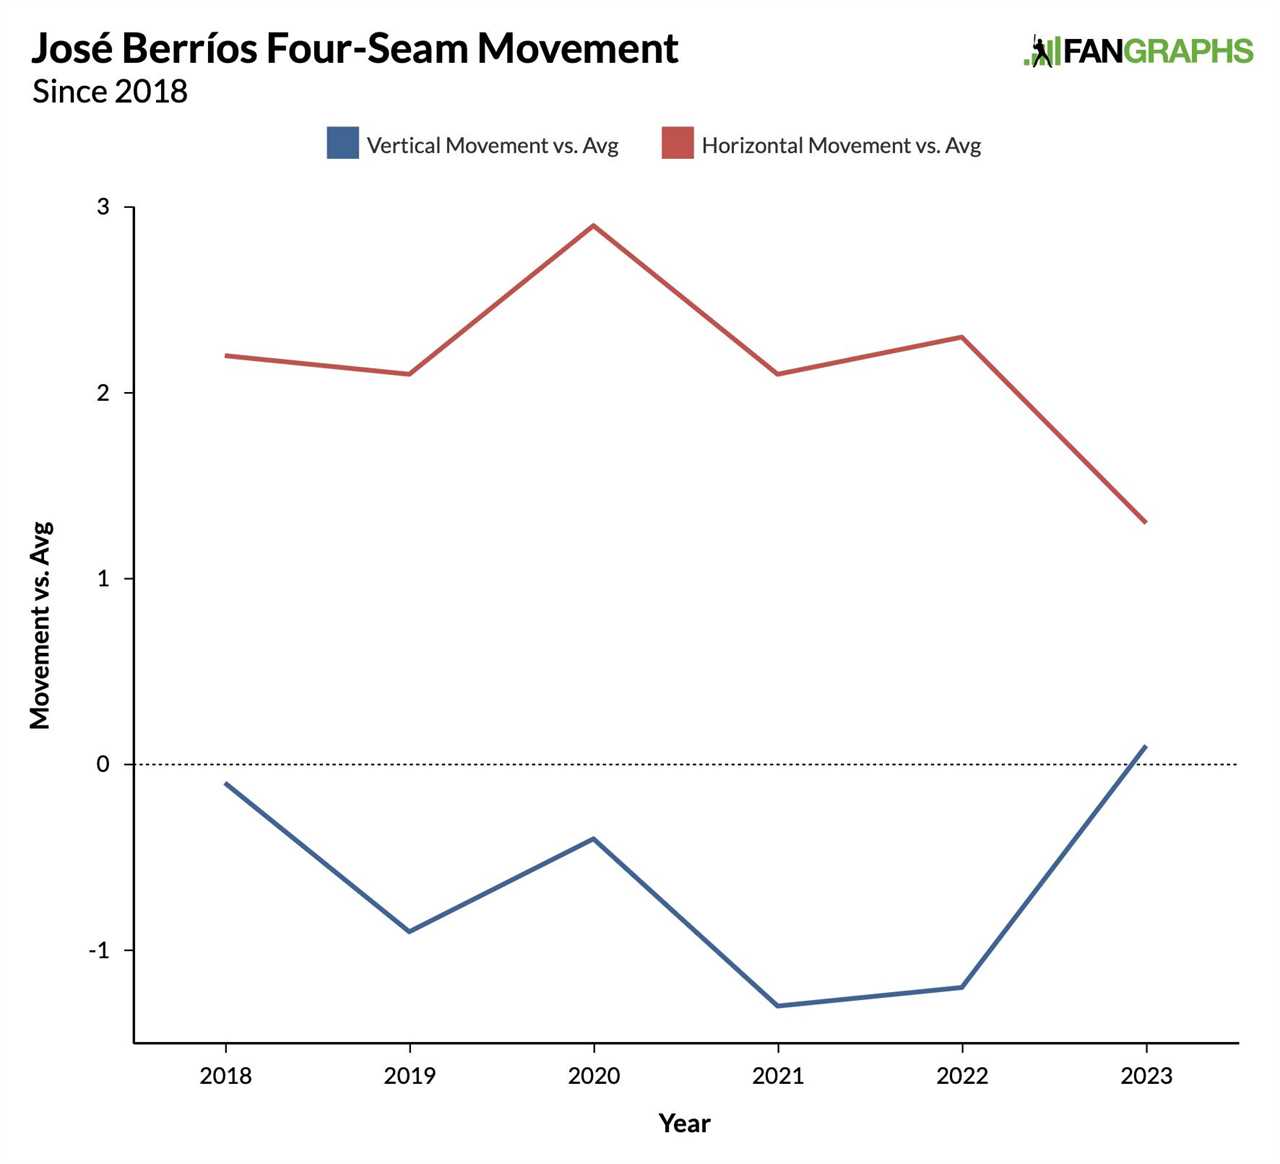
Data via Baseball Savant
My quest for the platonic ideal of a four-seam fastball was so fruitful that I decided to perform a similar search for sinkers and cutters. I still prioritized velocity, but for this investigation, I also took movement into account to narrow down the contenders. Call me a literalist, but I say the typical sinker needs to sink, and the typical cutter needs to cut.
Starting with sinkers, I picked out the 12 pitchers who came within one-quarter of a standard deviation of league average in velocity and within half a standard deviation in both vertical and horizontal movement. Next, I compared them all to league average in each of the additional categories I previously identified. Unfortunately, there wasn’t quite as clear of a winner this time around.
Only one pitcher, Colin Rea, finished within one standard deviation of league average in every metric (including mph). However, eight others finished within one standard deviation in nine out of 10. When I narrowed the criteria to half a standard deviation, Rea remained in the lead, meeting the criteria in nine of the 10 metrics, but he was tied with three other pitchers: Mitch Keller, Miles Mikolas, and Bryse Wilson. Meanwhile, at a quarter of a standard deviation, Rea reclaimed sole position of first place (eight out of 10), but three more arms were right on his tail with seven: Mikolas, Pedro Avila, and Brandon Pfaadt. What’s more, one of the metrics in which Rea wasn’t particularly close to league average was vertical movement, and that seems pretty important for a sinker. Among the quartet of Rea, Mikolas, Avila, and Pfaadt, only Avila came within a quarter of a standard deviation of league average in vertical movement. Finally, when I went down to an eighth of a standard deviation away from league average, Rea lost his crown to Avila, who came that close to league average in six different metrics. Rea and Noah Davis finished right behind him with five each.
The names that came up most often in the previous paragraph were Rea, Avila, and Mikolas. However, only one of those three threw his sinker with precisely league-average velocity. Indeed, only one of those three came within half a mile per hour of average. What’s more, that same pitcher was the only candidate out of 12 who came within an eighth of a standard deviation of league average in both vertical and horizontal movement, and one of only two who came within a quarter: Pedro Avila.
Avila, Rea, and Mikolas Sinkers
| Pitcher |
mph |
V Release |
H Release |
Ext. |
Pcvd. Velo |
V Mvt. |
H Mvt. |
Spin |
Total Mvt. |
Active Spin |
| Avila |
93.3 |
5.56 |
-1.24 |
6.4 |
93.4 |
-0.3 |
-0.2 |
2281 |
17.5 |
76% |
| Rea |
92.6 |
5.58 |
-2.1 |
6.7 |
93.2 |
-1.2 |
-0.1 |
2136 |
17.9 |
84% |
| Mikolas |
92.7 |
6.49 |
-2.1 |
6.4 |
92.8 |
-0.8 |
-0.2 |
2193 |
18.1 |
84% |
SOURCE: Baseball Savant
*Horizontal release point average for RHP
**Average is a close approximation using available data
Likewise with the cutter, there were no exact matches. I picked out the 14 contenders who came within half a standard deviation of league average in velocity and both planes of movement, but none of those 14 came within one standard deviation of league average in every other metric. Nonetheless, there was still a clear winner. Only one pitcher came within half a standard deviation of average in nine categories, within a quarter in six categories, and within an eighth in five. He was one of only four pitchers within half a standard deviation of league average in both vertical and horizontal movement and within a rounding error of league average in velocity. And out of those four, he was easily the closest to league average in release point and extension. It’s Javier Assad.
Javier Assad’s Cutter
| Pitcher |
mph |
V Release |
H Release |
Ext. |
Pcvd. Velo |
V Mvt. |
H Mvt. |
Spin |
Total Mvt. |
Active Spin |
| Assad |
89.1 |
5.94 |
-1.81 |
6.4 |
89.7 |
0.8 |
0.6 |
2046 |
8.2 |
57% |
SOURCE: Baseball Savant
*Horizontal release point average for RHP
**Average is a close approximation using available data
Here at FanGraphs, we pay a ton of attention to average performance. The concept of “league average” informs some of our most foundational stats. We even have a tab on the leaderboards page (+ Stats) dedicated to precisely that. It’s not hard to see why; a good sense of average performance, whether for a team, a player, or an individual skill, has all sorts of practical applications. Sometimes, however, it’s just as interesting to take a step back from results and focus on the process instead. We talk a whole lot about four-seamers, sinkers, and cutters, and it’s helpful to visualize those concepts as best we can. In 2023, it was Berríos, Avila, and Assad who made that possible.
So, there you have it, Tony. It’s been fun! Let’s grab a coffee sometime soon.
Source
https://blogs.fangraphs.com/the-most-normal-pitches-in-baseball-fastball-edition/
