
Jay Biggerstaff-USA TODAY Sports
I can’t possibly begin to cover all the excellent work concerning Statcast’s new bat tracking data. Now as much as ever, it’s important to support your local Baseball Prospectuses, PitcherLists, Baseball Americas, FanGraphses and freelance Substack writers. We move quickly in these parts. There’s so much analysis to consume, all of it superb.
When confronted with this new data, one of my first instincts was to see which metrics from other areas of sabermetric analysis could be replicated within the bat tracking framework. Enter 90th-percentile exit velocity (90EV); it’s a powerful shorthand metric that distills a lot of information about the top end of a hitter’s exit velocity distribution into a single number. It’s not perfect, and other metrics outperform it, but it’s easy to see how it has become popular in contemporary analysis, especially in prospecting and scouting circles.
So I looked to 90EV for inspiration with respect to bat speed. I assumed bat speed, being a primary input to exit velocity, would exhibit similar strengths in characterizing a hitter’s distribution of bat speeds by consolidating the most crucial speeds into a single value. Indeed, parsing bat speeds into deciles appears to work really well:
Bat Speed Percentiles
| Bat Speed Decile |
Avg EV |
Contact% |
Barrel% |
Square Up% |
Blast% |
xwOBAcon |
| 0th up to 10th |
71.2 |
65.4% |
0.1% |
36.3% |
4.3% |
.130 |
| 10th up to 20th |
77.2 |
78.2% |
1.3% |
39.5% |
8.5% |
.191 |
| 20th up to 30th |
78.9 |
78.9% |
2.9% |
36.9% |
11.5% |
.232 |
| 30th up to 40th |
80.5 |
79.2% |
3.5% |
36.5% |
13.4% |
.256 |
| 40th up to 50th |
82.1 |
78.8% |
5.5% |
37.2% |
16.0% |
.284 |
| 50th up to 60th |
83.3 |
79.3% |
7.2% |
37.4% |
18.5% |
.307 |
| 60th up to 70th |
84.6 |
78.1% |
8.3% |
38.6% |
20.1% |
.322 |
| 70th up to 80th |
86.2 |
78.0% |
12.1% |
39.6% |
23.3% |
.369 |
| 80th up to 90th |
87.7 |
77.6% |
11.9% |
40.9% |
25.3% |
.377 |
| 90th through 100th |
88.5 |
82.3% |
13.8% |
40.4% |
29.2% |
.404 |
Average exit velocity increases linearly with bat speed. So does contact quality (xwOBA on contact, or xwOBAcon) and barrel rate (Barrel%). All of these trends meet expectations. What defies expectations, however, is that contact rate (Contact%) spikes for a hitter’s top 10% of bat speeds. Whereas bat speed correlates positively with whiffs (that is, more bat speed typically means more whiffs), the average hitter’s fastest swings evidently produce more contact, not less, and by a substantial margin to boot. That’s an amazing collective feat. It’s like the numeric equivalent of “seeing beach balls.”
There’s more to this than meets the eye. Why is this possible? Let’s view the predicament through the lens of physics. Do you remember physics? One thing I remember — in addition to spending an inordinate amount of time across several days with my friend Kevin trying to bounce an empty plastic apple juice bottle on its side to get it to land upside-down on its cap — is that force equals mass times acceleration. Not velocity, but acceleration. The typical swing starts at an initial velocity of zero and makes contact at a final instantaneous velocity of X (in this case, “Bat Speed”). To reach X mph from 0 mph, the bat must accelerate. How much the bat accelerates determines how much force the hitter imparts upon the ball. And what is a hitter’s primary job if not to impart force upon an unsuspecting, unassuming baseball?
The bat tracking data from Statcast does not include mass (i.e., the weight of the bat), and we barely have acceleration. At best, we must make a flawed assumption that bat acceleration is constant throughout a hitter’s swing. (We make the same assumption for a pitch’s movement through space — how bad could it be? Maybe don’t answer that question.) I cobbled together some crude acceleration estimates based on bat speed and swing length using my extremely time-withered recounting of 11th-grade physics as a Martinelli’s bottle tumbled through my brain. Villain origin story aside, what relevance is acceleration if we have final speed? Namely, we can use acceleration to diagnose differences in seemingly identical bat speeds. Consider two swings with bat speeds of exactly 75 mph, yet one swing is only seven feet long, the other eight feet. We can assume the former swing had to accelerate more quickly across a smaller distance to reach the same instantaneous velocity on contact as the latter.
So instead, how do a hitter’s bat acceleration deciles correspond with various measures of production? Much differently:
Bat Acceleration Percentiles
| Bat Acceleration Decile |
Avg EV |
Contact% |
Barrel% |
Square Up% |
Blast% |
xwOBAcon |
| 0th up to 10th |
68.8 |
52.9% |
0.3% |
25.5% |
3.5% |
.112 |
| 10th up to 20th |
76.2 |
67.0% |
1.7% |
31.8% |
7.6% |
.177 |
| 20th up to 30th |
79.2 |
76.2% |
3.3% |
37.3% |
12.1% |
.232 |
| 30th up to 40th |
81.1 |
81.2% |
5.2% |
40.5% |
15.7% |
.277 |
| 40th up to 50th |
82.8 |
84.3% |
6.8% |
42.8% |
19.3% |
.311 |
| 50th up to 60th |
83.9 |
84.3% |
8.9% |
42.7% |
20.5% |
.333 |
| 60th up to 70th |
85.1 |
85.3% |
9.3% |
44.8% |
23.2% |
.351 |
| 70th up to 80th |
85.7 |
84.5% |
10.2% |
43.4% |
23.3% |
.363 |
| 80th up to 90th |
86.4 |
80.9% |
11.0% |
40.2% |
23.0% |
.368 |
| 90th through 100th |
86.4 |
79.6% |
10.3% |
34.9% |
22.2% |
.350 |
In moving from the penultimate decile to the top decile, the league-average exit velocity plateaus at 86.4 mph (rather than continuing to increase linearly). Contact rates peak closer to somewhere between the 60th and 70th percentiles, as does Statcast’s new square-up percentage (Square-Up%). Barrels peak below the 90th percentile, as does Statcast’s new Blast rate metric (Blast%), as well as our tried-and-true xwOBAcon. The texture of assessing swing efficacy (through the viewpoint of a single bat tracking measurement) has changed entirely.
All of which is to say that daddy hacks — true swing-out-of-your-shoes daddy hacks — perhaps aren’t the best way for a hitter to optimize his offensive production. Which isn’t to say that daddy hacks aren’t good, productive swings — they are still among the most productive swings a hitter can make, and a hitter ought to err on the side of too much acceleration rather than not enough — but this is a question of optimization, not magnitude.
What, then, is the best way to optimize? What’s the ideal combination of bat speed and bat acceleration, using this unsophisticated percentile framework? It’s somewhere in the red-highlighted area below, which is typically not where a hitter maximizes his acceleration:
Bat Speed x Bat Acceleration: xwOBAcon
Acceleration →
↓ Speed |
0th-10th |
10th-20th |
20th-30th |
30th-40th |
40th-50th |
50th-60th |
60th-70th |
70th-80th |
80th-90th |
90th-100th |
| 0th up to 10th |
.113 |
.187 |
.166 |
.160 |
.143 |
.129 |
.083 |
.076 |
.000 |
.123 |
| 10th up to 20th |
.121 |
.223 |
.239 |
.233 |
.202 |
.188 |
.172 |
.131 |
.083 |
.051 |
| 20th up to 30th |
.095 |
.184 |
.283 |
.298 |
.288 |
.238 |
.261 |
.224 |
.158 |
.071 |
| 30th up to 40th |
.060 |
.150 |
.264 |
.312 |
.336 |
.286 |
.286 |
.263 |
.207 |
.113 |
| 40th up to 50th |
.004 |
.119 |
.246 |
.320 |
.341 |
.352 |
.348 |
.297 |
.255 |
.144 |
| 50th up to 60th |
.012 |
.099 |
.216 |
.324 |
.355 |
.347 |
.363 |
.333 |
.285 |
.242 |
| 60th up to 70th |
.000 |
.057 |
.134 |
.272 |
.364 |
.382 |
.358 |
.354 |
.347 |
.234 |
| 70th up to 80th |
.000 |
.119 |
.116 |
.233 |
.323 |
.401 |
.413 |
.436 |
.397 |
.336 |
| 80th up to 90th |
.000 |
.210 |
.105 |
.108 |
.234 |
.382 |
.386 |
.435 |
.436 |
.360 |
| 90th through 100th |
.426 |
.000 |
.247 |
.145 |
.216 |
.253 |
.379 |
.402 |
.455 |
.410 |
It is where he maximizes bat speed, but through a longer swing that allows more time to accelerate (at a slightly lower rate of acceleration) to its maximum speed. That’s not something you can glean from bat speed alone. As such, top-10% bat speed as a 90EV-equivalent metric simply does not capture the information we want it to capture, at least not in its entirety.
The solution to the problem of optimization vis-à-vis contact quality for any hitter, regardless of size and strength, is to minimize swing length for any given bat speed (red = high average exit velocity, blue = low).
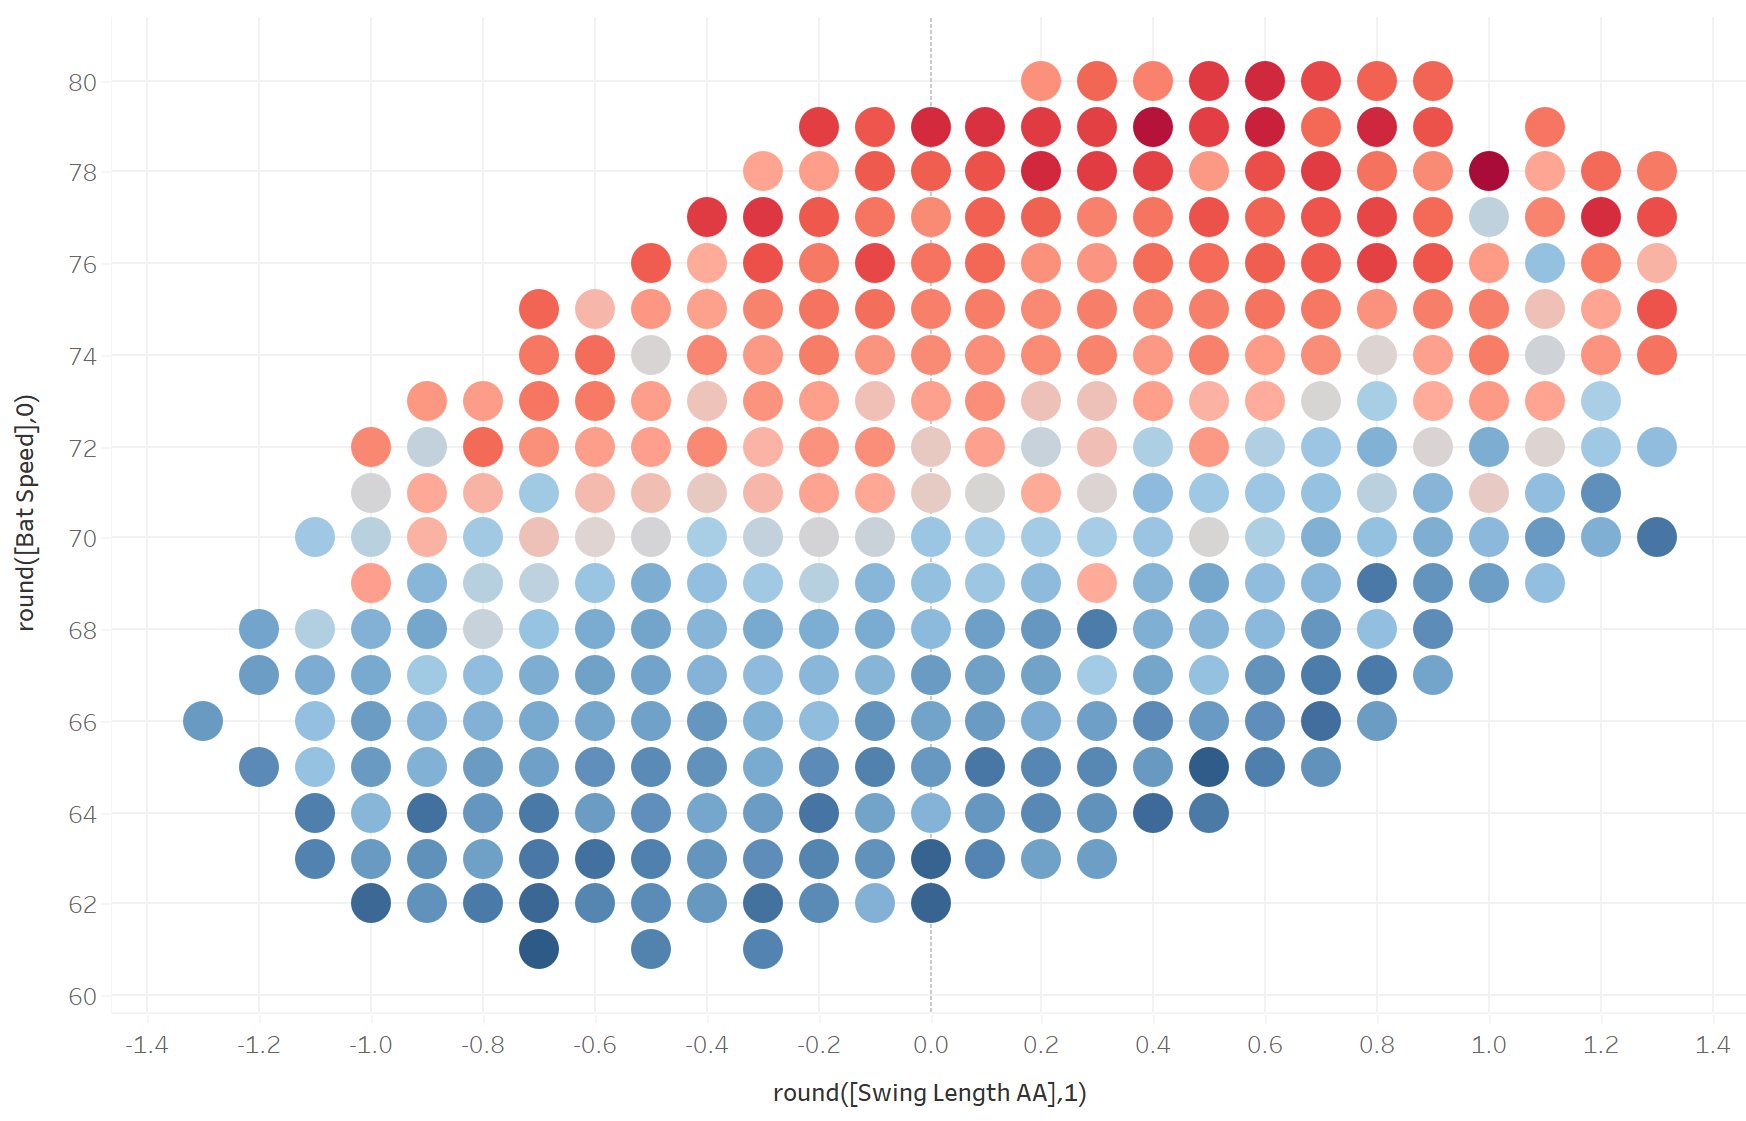
To be clear, long swings aren’t bad; in fact, a longer swing (in distance, not time) tends to denote more distance across which to accelerate, which naturally creates more bat speed. You can actually see that longer swings are associated with higher bat speeds and higher exit velocities. But if a hitter can achieve the same bat speed with a shorter swing, he will inherently generate more acceleration.
Presumably not all hitters take daddy hacks at the same frequency. At the same time, I cannot with any confidence attest to which hitters take more daddy hacks than others. Knowing what we know about them, I doubt Steven Kwan takes anywhere near as many daddy hacks as Javier Báez. This is why I have taken care to refer to league averages and “the typical hitter.” At what threshold above a hitter’s average bat speed do contact rate and quality start to degrade? Does that threshold change from hitter to hitter?
As for daddy hacks themselves, both bat speed and acceleration correlate directly with ball-strike count. Bat speed and acceleration peak when the count is most in their favor (3-0), and decrease steadily as the count becomes less favorable, with hitters’ slowest swings occurring in 0-2 counts. It is in those advantageous counts that hitters possibly do themselves a disservice (just barely a disservice, but a disservice nonetheless) by taking daddy hacks rather than taking a little off it to ensure they square it up a little better — to ensure the chaos is in fact controlled:
xwOBAcon by Bat Acceleration and Count
| Bat Acceleration Decile |
Ahead |
Even |
Behind |
Two Strikes |
| 0th up to 10th |
.225 |
.221 |
.245 |
.081 |
| 10th up to 20th |
.275 |
.257 |
.287 |
.135 |
| 20th up to 30th |
.311 |
.305 |
.295 |
.179 |
| 30th up to 40th |
.343 |
.344 |
.320 |
.216 |
| 40th up to 50th |
.373 |
.359 |
.355 |
.252 |
| 50th up to 60th |
.390 |
.395 |
.363 |
.263 |
| 60th up to 70th |
.428 |
.393 |
.398 |
.277 |
| 70th up to 80th |
.441 |
.407 |
.393 |
.285 |
| 80th up to 90th |
.467 |
.433 |
.407 |
.265 |
| 90th through 100th |
.455 |
.408 |
.348 |
.255 |
The very best swings, then, appear to be those that increase bat speed through acceleration rather than swing length, neutral of pitch location. I say “neutral of swing location” because swing length correlates with lateral (east-west) pitch location, with inner-half pull-side approaches yielding longer swings. The red-and-blue jelly bean above shows that swing length is positively correlated with exit velocity, so it makes sense that pull-side swings yield superb results. They not only take advantage of a shorter outfield wall distance but also enable the hitter to generate more bat speed across a longer swing distance. Two swings with identical rates of acceleration will produce different swing lengths and final bat speeds based exclusively on the pitch’s location. This whole thing has been about the swing — it’s primarily about the swing — but it’s about swing decisions, too, and the augmentative powers of those decisions.
Bat speed becomes reliable much more quickly than exit velocity, which on its own should quickly cement it into the analytical toolbox. Like any other metric, though, it still requires an immense amount of context, lest we risk comparing apples to oranges. Acceleration is some of that necessary context, and I anticipate that once we have year-over-year data, we will use it to diagnose injuries or spot signs of decline better than bat speed by itself.
All stats are through May 19.
Source
https://blogs.fangraphs.com/daddy-hacks-or-the-lone-peril-of-swinging-too-hard/
