John E. Sokolowski-USA TODAY Sports
On Monday, I dove into Kevin Gausman’s fast and furious two-strike fastball approach. Last season, Gausman led the majors in terms of the velocity gap between his normal fastballs and his two-strike offerings, and he prospered with that approach. In 2022, however, he had the same juicy gain in velocity and was one of the worst pitchers in baseball with two strikes.
In that article, I mused that it was really difficult to know what pitchers were doing differently with two strikes. Short of using a stuff model, I said, trying to figure out relative pitch quality between two-strike fastballs and their early-count brethren wouldn’t work. Then I had an epiphany. We have a stuff model. We have two, in fact, one of which is entirely in-house. So like a kid asking for the keys to the candy store, I went to David Appelman and asked if I could get pitch-by-pitch stuff grades.
Now I have those! It turns out that running a giant data-focused baseball website comes with access to a tremendous amount of baseball data. I pulled every four-seam fastball thrown in 2023 and broke them into two categories for every player: two-strike counts and all other counts.
The PitchingBot model makes three independent calculations: stuff, command, and overall. Each runs without consulting the others, so you can’t just add stuff and command to produce an overall number. That’s a feature, not a bug; those things don’t necessarily combine in a linear fashion, so in addition to running stuff and command values, you need to run the whole thing together. With that in mind, let’s look at Gausman’s performance in 2023. Note that in PitchingBot parlance, negative numbers are better for the pitcher:
Kevin Gausman, 2023 Fastballs By Count
| Count |
Velo |
Bot Stuff RV/100 |
Bot Command RV/100 |
Bot Overall RV/100 |
| Not Two Strikes |
94.2 |
-2.69 |
-1.18 |
-0.98 |
| Two Strikes |
95.9 |
-3.01 |
-0.61 |
-0.92 |
You might be used to seeing PitchingBot grades expressed on the 20-80 scale, but I stuck with the run values that inform that scale. Why? It lets me avoid having to normalize each grade, because I’m not exactly sure what population would be most informative to normalize against. Still, if you want to compare each bucket to all fastballs overall, it would look like this:
Kevin Gausman, 2023 Fastballs By Count
| Count |
Velo |
Bot Stuff Grade |
Bot Command Grade |
Bot Overall Grade |
| Not Two Strikes |
94.2 |
51 |
67 |
62 |
| Two Strikes |
95.9 |
54 |
57 |
61 |
In other words, Gausman absolutely muscles up, and you can see it reflected in his stuff grade ticking up. But his location gets meaningfully worse, by more than enough to offset the increase in nastiness. Even though Gausman’s fastball burns up radar guns with two strikes, the overall effect simply isn’t that great. And even if he weren’t suffering from location problems, the change in run values isn’t that significant. And that’s for the pitcher who adds the most velocity, so you can imagine that lesser lights aren’t getting much of an effect at all.
It makes sense to me that simply reaching back for more oomph doesn’t necessarily make for a better stuff grade, because there’s plenty of other things that go into the model. Sure, getting stronger and throwing harder with the same mechanics will almost always make PitchingBot drool. But if you’ve ever tried to wing a ball as hard as you absolutely can, with 101% effort, you know that your mechanics don’t always stay perfect while you do it. A list of the pitchers who add the most velocity with two strikes makes that quite clear:
Two-Strike Velo Increasers, PitchingBot RV Changes
That’s a shocking chart, at least to me. Ten of the 15 pitchers who add the most velo with two strikes see their modeled stuff get worse. Thirteen of the 15 see their overall run values decrease. Everyone’s gassing up, but more so with raw velocity than with actually making the pitch harder to hit. And all that max-effort tossing is understandably making location worse. The result is that the model likes two-strike fastballs less than ones thrown earlier in the count.
It’s actually even a little wilder than that. PitchingBot thinks that two-strike fastballs have worse stuff overall. It’s not just the hardest throwers; averaged across the population, stuff grades on two-strike fastballs decline by 0.69 runs per 100 pitches, or roughly eight points on the PitchingBot grading scale. Location, meanwhile, gets worse by 14 points, and overall fastball value gets worse by 11 points.
Let’s take each of these in order to try to unravel the mystery of what is going on here. First, there’s the stuff component. Fastballs get harder, but the model doesn’t like them more. In fact, it likes them meaningfully less. Why? The whole point of these kinds of models is that they’re non-linear, so I can’t just say, “Oh, it’s x points of vertical break and y points of release point change.” Instead, I’ll look at one pitcher in particular and see how their fastball changes in two-strike counts. My target? Shohei Ohtani, of course.
I grabbed some relevant metrics that feed into the model and separated them out by count. When Ohtani reaches back for a tick and a half extra, his fastball shape changes meaningfully:
Shohei Ohtani, 2023 Fastballs by Count
| Count |
Velo (mph) |
Spin Rate |
Spin/Velo Ratio |
Extension (ft) |
Release Height |
HMov (in) |
VMov (in) |
VMov + Gravity |
| Not Two Strikes |
96.4 |
2240 |
23.2 |
6.9 |
5.69 |
4.4 |
14.4 |
-15.2 |
| Two Strikes |
97.9 |
2305 |
23.5 |
6.9 |
5.65 |
3.5 |
13.5 |
-15.1 |
When he’s throwing harder, he can’t get nearly as much movement on the pitch. Some of that is because it has less time to break when thrown faster, but it also just has less movement. Despite that increase in velocity, the pitch drops just as much on its path to home plate. In other words, that coveted flat fastball shape disappears when he tries to put something extra on it.
That’s not what happens to everyone, of course. Wade Miley’s fastball loses its shape somewhat, and the velocity he’s gaining simply isn’t that important because he doesn’t throw hard in the first place. Shane McClanahan’s spin rate stays unchanged even as he increases his velo, which means he’s spinning it less on an adjusted basis, and his release point falls. It’s not any one particular thing, but pitchers don’t seem to execute the same types of fastballs when they throw harder.
Or at least, some don’t. Aroldis Chapman is a great example of someone who has a great max-effort fastball that he seemingly saves for two-strike counts. His spin/velocity ratio increases, his release point actually makes the pitch flatter, and the net result is that his two-strike fastball explodes, dropping an inch less on its path homeward while getting just as much tail. Those extra ticks matter more when you’re already pushing 100, too.
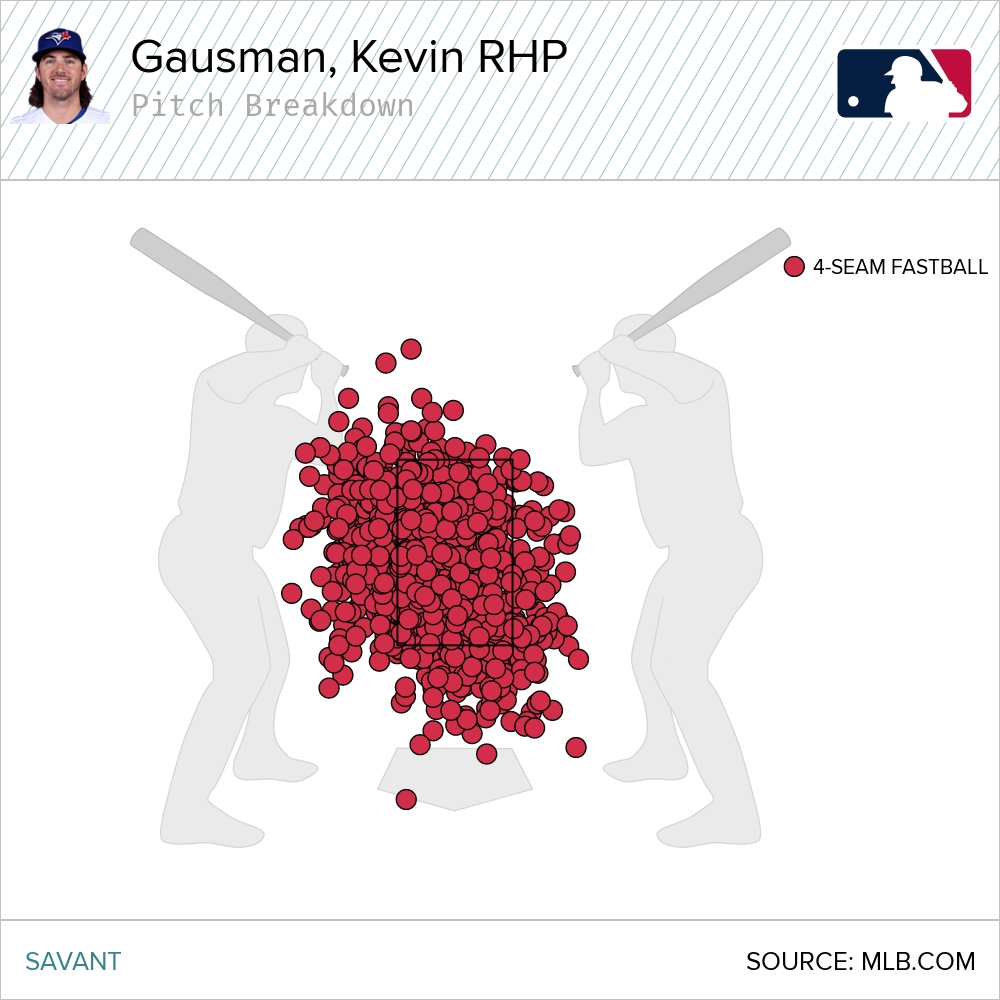
How about location? We’ll head back to Gausman for that one. A visual check doesn’t make this very clear. Here’s his fastball in non-two-strike counts, for example:

Yeah, we can’t really work with that. But if we break things down into specific zones, there are a few issues. He hits the upper third and the areas that surround it but are just off the plate less frequently. He hits the shadow-in zone, where he’s just tickling the edges of the plate, less frequently. He misses wildly slightly more often. In other words, his command simply declines, hardly shocking given how much effort he’s adding.
One thing worth noting here: BotCommand uses count as an input. Obviously, it has to; ideal location is a lot different in 0-2 and 3-0 counts. Thus, the comparison might not be exactly apples to apples; hitting the same location in the two counts could lead to different command scores.
On the other hand, stuff doesn’t use count as an input, so the effect we’re seeing there is clear. Pitchers lose enough auxiliary stuff in their attempt to add velocity that the net effect is counterproductive, and that’s before we even get to how it messes with their ability to locate. The overall effect is that pitchers are throwing slightly worse fastballs to slightly worse locations.
Is that all we can get out of this research? I’m not so sure. There are still some interesting correlations to investigate. For all my tut-tutting about pitchers who reach back for too much velocity, there’s a correlation between added two-strike velocity and change in two-strike stuff: the more velocity you add, the less your stuff declines. My interpretation of that finding is that everyone is trying to muscle up, and that two-strike counts inherently produce some worse pitch shapes as a result. The pitchers who can actually add enough velocity to make up for the decline elsewhere do best.
That’s really just speculation, though. It’s an inherent limitation of these opaque pitch quality models, but it’s also just a limitation of baseball analysis. I”m not sure if I’m right, but I at least like the story I’m telling.
While we’re on the topic, it’s worth mentioning that Gausman isn’t a complete slouch when it comes to two-strike fastballs. Sure, the shape gets worse, but all that added velocity really does help the pitch’s stuff score. He’s 25th among 450 pitchers who threw at least 40 two-strike fastballs when it comes to change in stuff. The top of that list has a bunch of elite strikeout artists, too: Chapman, Félix Bautista, Ryan Helsley, Eury Pérez, Carlos Hernández, and Phil Maton are all in the top 10.
The list of pitchers who show the greatest positive change in overall fastball model value with two strikes has the best confirmation of a statistic I can imagine: Jacob deGrom is in the top five. So is Ben Joyce, who barely adds any velocity but locates incredibly well. Adam Cimber and Pete Fairbanks fit that mold, too. There are clearly a lot of ways to succeed with two strikes.
Last but not least, pitchers whose overall grades increase in two-strike counts really do see better results in those counts. Pitchers with higher BotOverall grades on their two strike fastballs – the raw number, not the change compared to early-count fastballs – get better overall results on those pitches. If you can figure out a way to improve your fastball with two strikes, you’ll reap the benefits. Most pitchers can’t seem to manage it, though.
Source
https://blogs.fangraphs.com/examining-two-strike-fastballs-with-pitch-modeling/
 Backyard GrillingWeekend WarriorsAdvice from DadBeard GroomingTV Shows for Guys4x4 Off-Road CarsMens FashionSports NewsAncient Archeology World NewsPrivacy PolicyTerms And Conditions
