Robert Edwards-USA TODAY Sports
In his recent piece about umpire accuracy, Davy Andrews noted that plate umpires correctly called 99.26% of heart zone pitches in 2023. When I first read that number, I didn’t think missed calls in the heart zone warranted any closer investigation. For most of us, ninety-nine point anything is as good as 100; you don’t spend much time worrying about the 0.01% of germs Purell can’t kill. Then again, if you were to consider the sheer amount of bacteria on your hands at any given moment, you might opt for a second squirt of sanitizer. A tiny percentage of a tremendous number is still going to be a pretty big number. The same is true for missed calls in the heart zone. There aren’t quite as many pitches in an MLB season as there are germs on your phone screen, but there are enough that a few tenths of percent of heart zone offerings still represents a pretty hefty figure. In 2023, plate umpires watched 381 pitches sail over the heart of the plate without signaling a strike. When you frame it that way (pun absolutely intended), it actually sounds pretty bad.
I wasn’t nearly as surprised to learn that plate umpires missed 428 calls in the chase zone last season. Offerings in the chase zone are designed to look hittable out of the pitcher’s hand. An especially talented catcher can make them look hittable as they reach his glove, too. Meanwhile, a batter might like to earn a few extra balls inside the zone, but he doesn’t have the same influence over calls as do his opponents. Besides, if a hitter recognizes that a pitch is coming for the heart zone, he’s not going to wriggle and contort his body in hopes of inducing a missed call – he’s going to swing. To that end, batters are much more likely to swing in the heart zone than the chase zone, which means that on a rate basis, umpires miss significantly more calls over the heart of the plate because there are fewer total pitches there that need to be called. While 381 and 428 are similar figures, batters took 2.4 times as many pitches in the chase zone as in the heart zone. Apparently, it’s harder than I thought to call strikes what they are.
As egregious as balls called in the heart zone might be, they don’t garner nearly as much attention as strikes called outside the zone. It’s a more common occurrence to see a batter up in arms over a bad called strike than it is to see a pitcher or catcher expressing a similar degree of anger over a pitch that wasn’t called in his favor. YouTube and Twitter are replete with “worst called strike” compilations, but the worst called balls often slip under the radar – at least when FanGraphs isn’t writing about them.
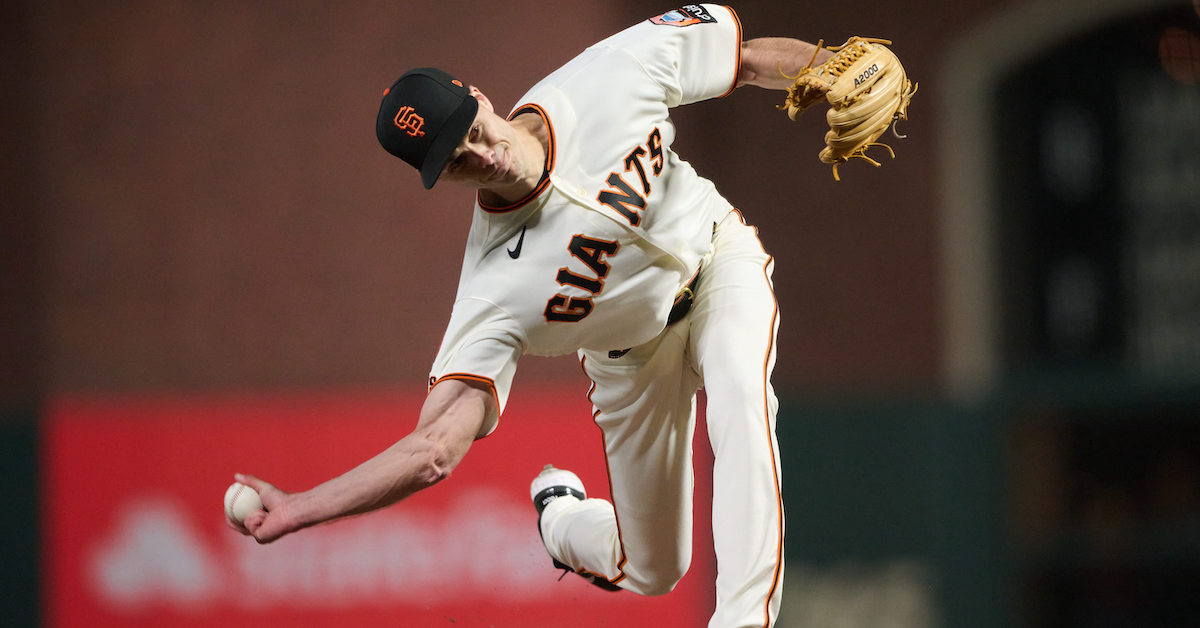
To be clear, I’m not here to rag on umpires. Rather, I’m interested in what might lead them to make mistakes on the most straightforward of strikes. After all, most meatballs don’t look like this:
Plenty of them look like this:
There has been no shortage of research into the factors that influence missed calls, both inside and outside the strike zone. However, I’m curious about what might differentiate balls called in the heart zone from those called around the edges. Heart zone balls are rare, but with so many seasons of data at our disposal, there is a large sample size to search for meaningful patterns.
When I first started looking into this topic, I thought it could be a dead end. What if balls called in the heart zone were just fluky mistakes? What if there wasn’t any rhyme or reason? Alternatively, I worried that heart zone balls might not be any different from missed calls in the rest of the strike zone. Thankfully, I never reached such an impasse. Instead, I found so many notable patterns that I don’t even know what to do with all of them. Well, actually, I do. I’m going to dump them all on you, dear reader.
Location
Data via Baseball Savant
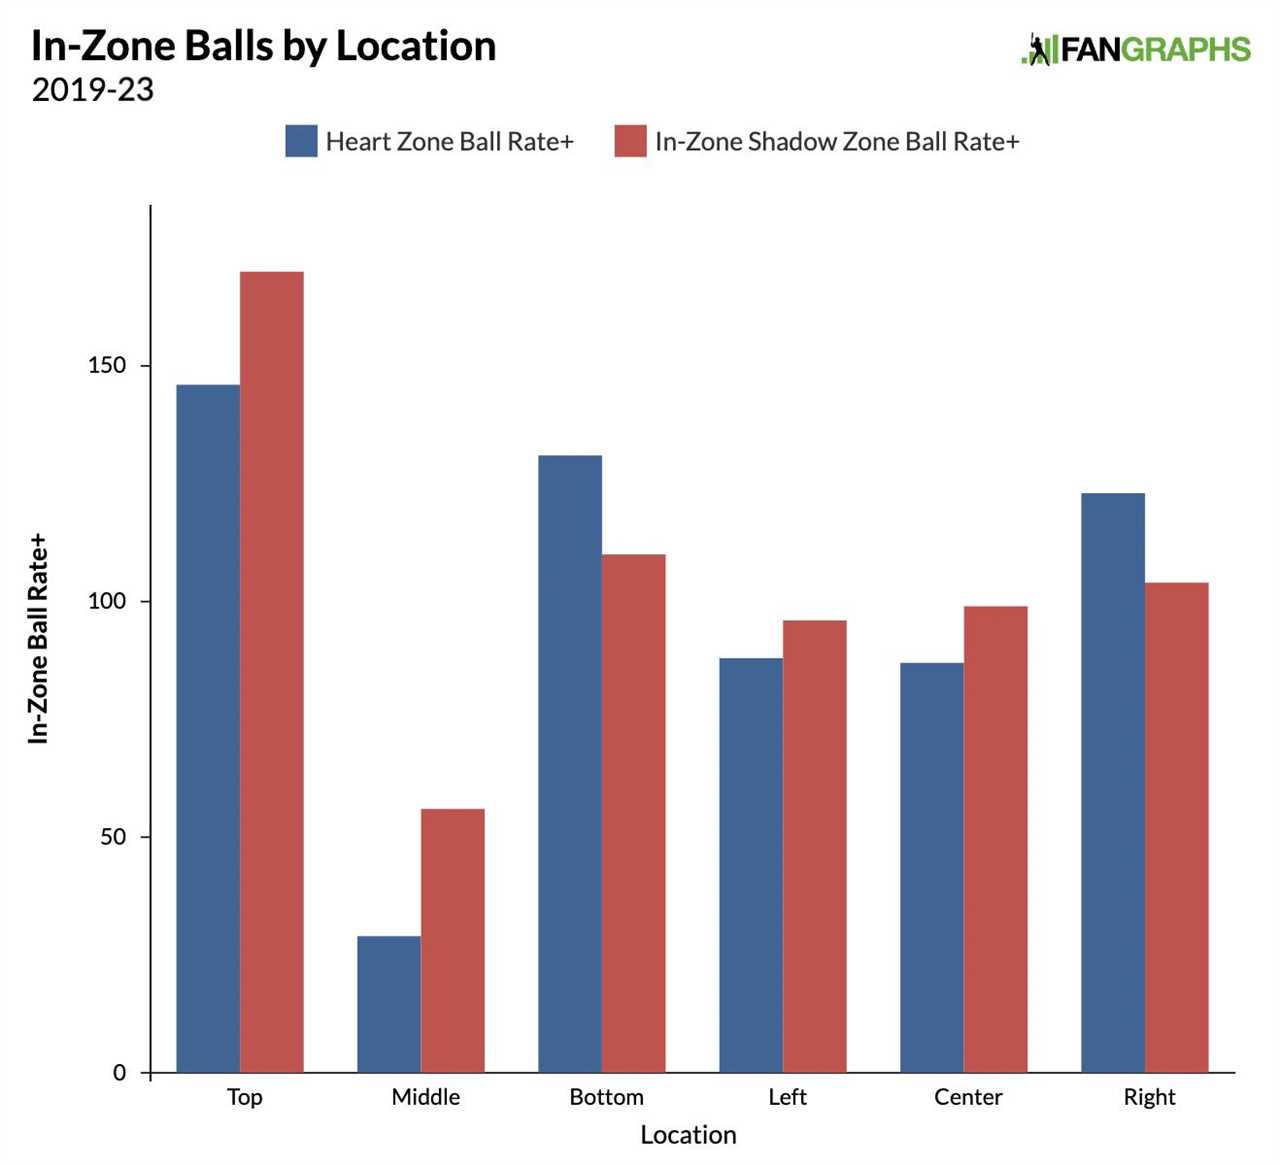
The graph above compares the locations of all in-zone pitches called balls over the past five years (2019-23). The blue bars represent heart zone balls, and the red bars represent in-zone shadow zone (IZSZ) balls. “Top” refers to the upper third of each zone (either heart or in-zone shadow), “middle” refers to the medial third, and “bottom” refers to the lower third. Similarly, “left,” “center,” and “right” refer to the vertical thirds of the zone facing third base, second base, and first base, respectively.
To calculate the figures you see in front of you, I took the number of called balls in each location and divided that by the total number of takes in each location. I then divided the result by the league average ball rate in that zone (again, either the heart zone or the IZSZ) and multiplied by 100 to put everything on the scale of the familiar “+” stats. Thus, a “Heart Zone Ball Rate+” of 100 means pitches in that location of the heart zone are just as likely to be called balls as they are anywhere else in the heart zone; the same goes for “In-Zone Shadow Zone Ball Rate+.” I should also mention that I removed zone 5 (the midpoint of the heart zone) from the data since it does not have an equivalent in the shadow zone. (Missed calls in zone 5 are incredibly rare anyway!) I promise it’s not as complicated as it sounds. In short, it’s all about putting every missed strike call on the same scale for easy comparison.
By and large, the same general trends are apparent in both the heart zone and IZSZ. For instance, plate umpires make far more mistakes at the top and bottom of the zone than in the middle. That’s true throughout the strike zone. However, there isn’t a major difference between the numbers at the top and bottom of the heart zone, whereas umpires have far more trouble at the top of IZSZ than the bottom.
Conversely, while plate umpires are pretty consistent from left to right in the shadow zone, they call far more balls on the right third (first base side) of the heart zone. This is true regardless of batter handedness, pitcher handedness, and platoon matchup, although the effect is noticeably stronger for left-handed batters than right-handed batters; it would seem that when lefties are batting, umpires have more trouble calling “inside” pitches than “outside” pitches in the heart zone. This effect isn’t tied to a specific pitch type, either, and it is consistent year after year. Umpires have called a disproportionate number of balls in the right third of the heart zone in every three-year period of the Statcast era (2015-present). There is just something about the first base side of the heart zone that makes umpires want to call a ball.
Pitch Type
Data via Baseball Savant
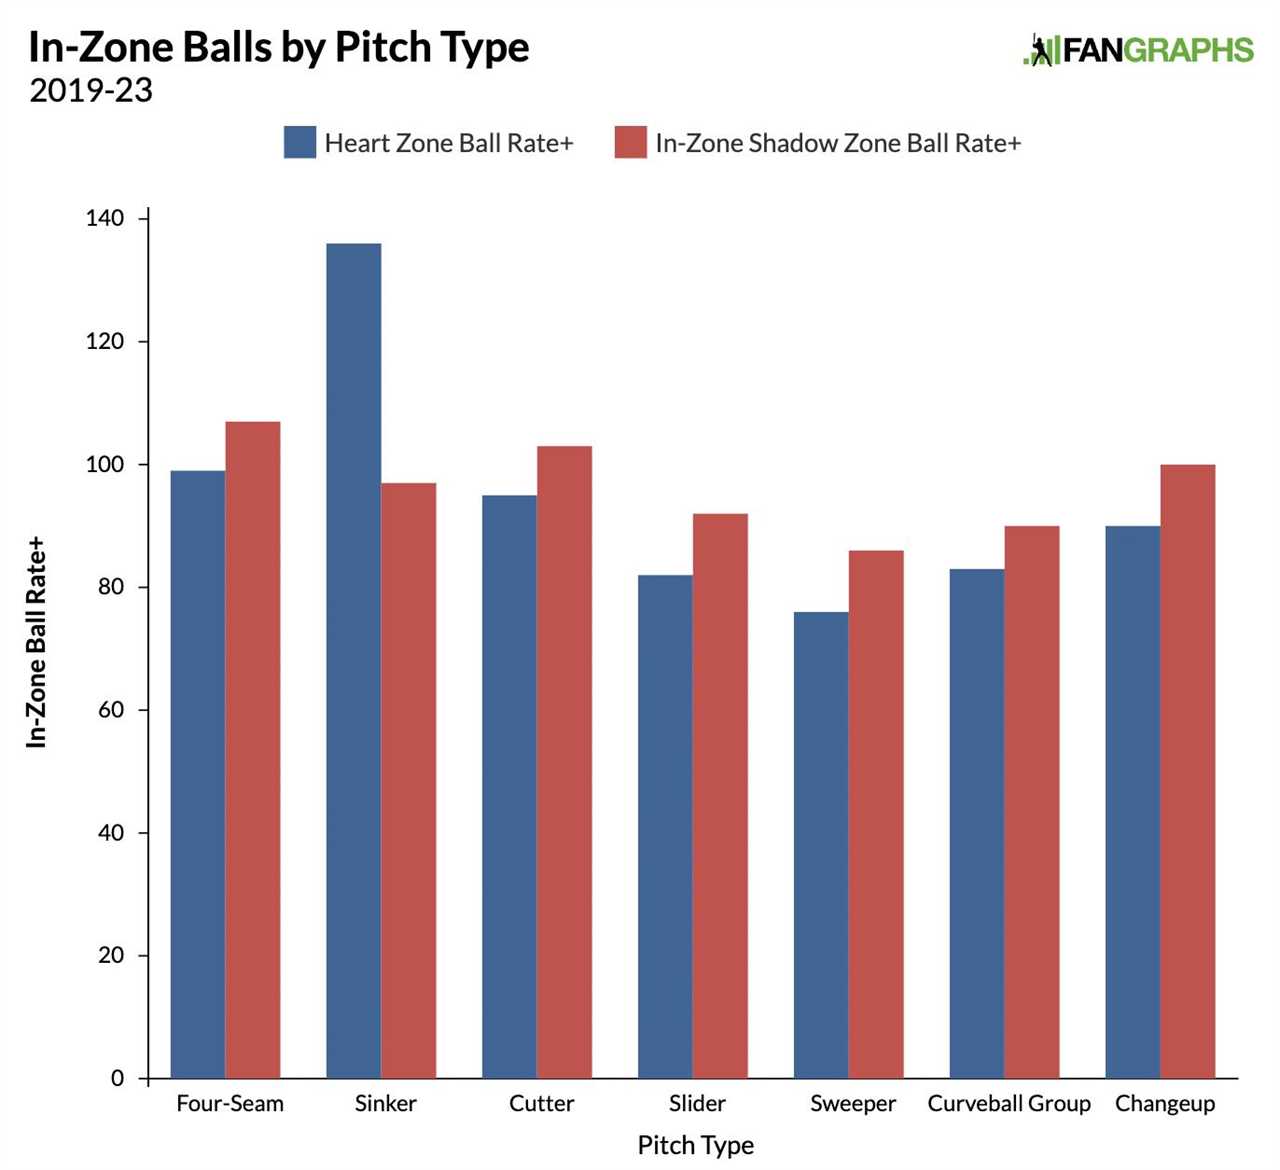
I constructed a similar graph sorting in-zone balls by pitch type instead of location, and the results speak for themselves. Sinkers are far more likely than any other pitch to be called a ball in the heart zone. No such effect exists in the shadow zone. There are some other noteworthy trends in the data – breaking balls are the pitches least likely to be misidentified in either zone – but that one blue bar towers over everything else. If the effect weren’t so consistent, I’d be sure it was a mistake. But sinkers have been far more likely than any other pitch to be called a ball in the heart zone in every three-year period since 2016-18. In fact, the effect has gotten even stronger in recent years, which coincides with the changing role of the sinker in the modern game.
There’s clearly a lot going on here, and there are no easy answers. One could write an entire article about heart zone sinkers alone. For instance, velocity certainly plays a role, but it’s not the driving factor. The likelihood of a heart zone sinker being called a ball increases the faster the sinker is thrown. However, if it were only about velocity, those blue bars would also be higher for the other fastballs in the data set. What’s more, even the slowest sinkers still generate more called balls in the heart zone than the average pitch:
Sinkers by Velocity (2019-23)
| Velocity Bucket |
Heart Zone Ball Rate+ |
| 89-90 mph |
130 |
| 90-91 mph |
141 |
| 91-92 mph |
105 |
| 92-93 mph |
123 |
| 93-94 mph |
142 |
| 94-95 mph |
133 |
| 95-96 mph |
147 |
| 96-97 mph |
150 |
| 97-98 mph |
175 |
| 98-99 mph |
233 |
| 99-100 mph |
205 |
| 100+ mph |
225 |
Data via Baseball Savant
Arm-side run could also be a part of it. Changeups and splitters (the other pitches known for their arm-side run) have higher heart zone ball rates than any pitches in the slider and curveball groups. Meanwhile, sweepers, which have more glove-side movement than any other pitch, are the least likely offering to result in a heart-zone ball.
On a similar note, sinkers typically run in on batters, because they are used more often when the pitcher has the platoon advantage. That could help to explain why they result in more heart zone balls. That said, heart zone sinkers are more likely to be called balls regardless of the platoon matchup. Whether it’s righty on righty, lefty on lefty, righty on lefty, or lefty on righty, a sinker in the heart zone is always more likely to be miscalled than the average pitch. There is just something about sinkers in the heart zone that makes umpires want to call a ball.
Platoon Splits
Data via Baseball Savant
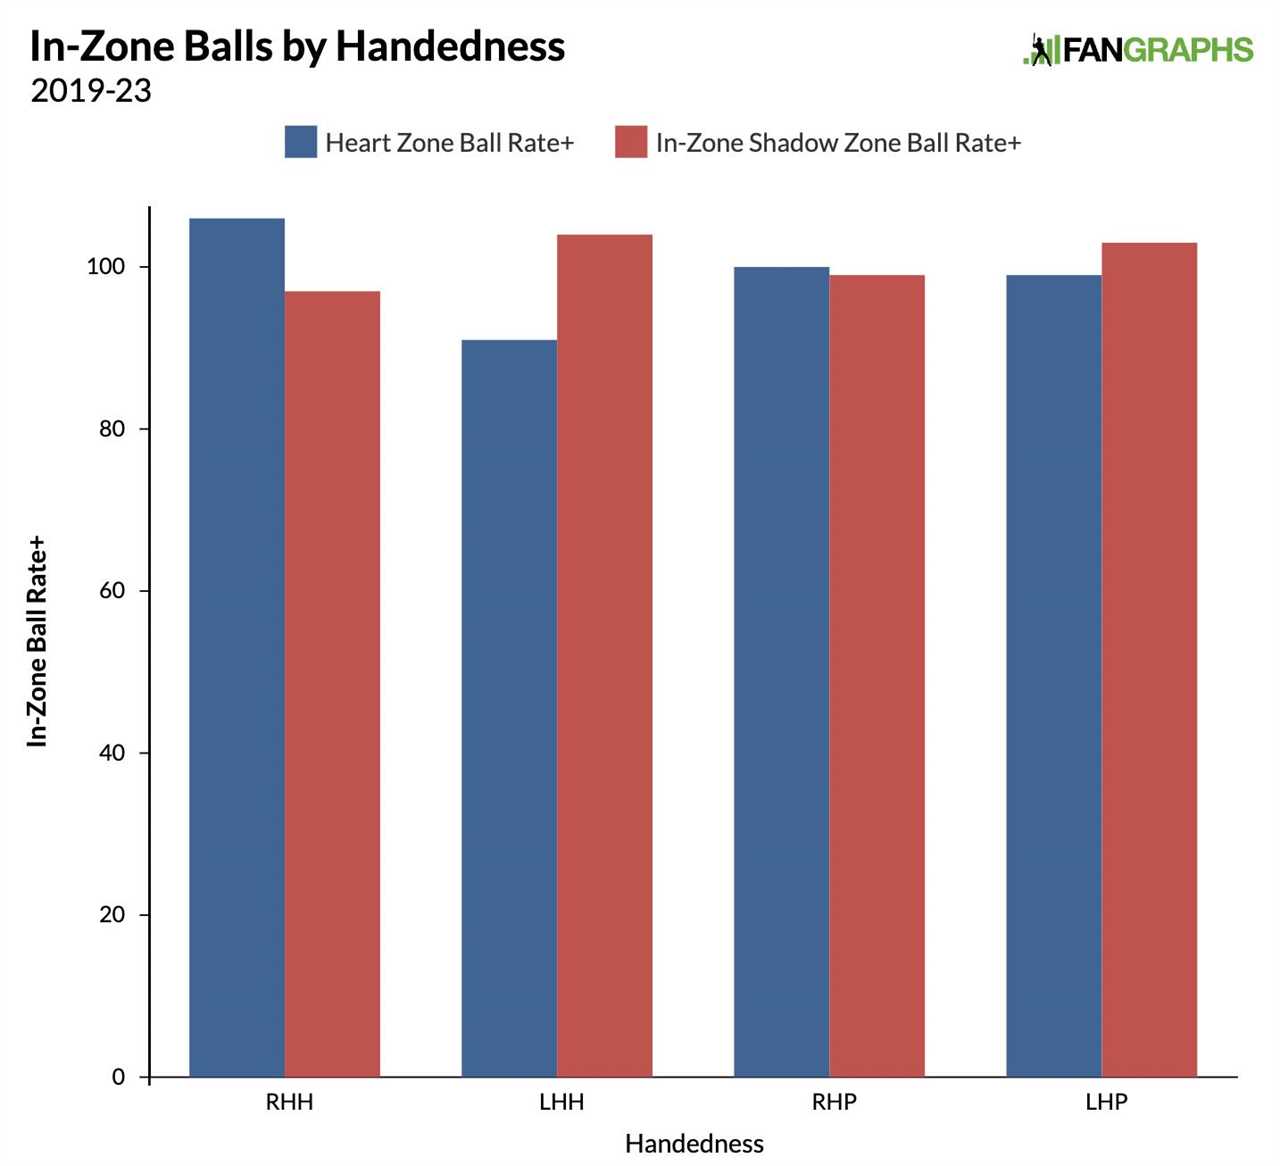
This graph isn’t as dramatic as some of the others we’ve looked at, but it shows that right-handed hitters are more likely to get a ball called in the heart zone than their lefty counterparts. This is particularly interesting because heart zone balls are more common on the first base side of the heart zone, which is the outside third for a righty batter. You might expect missed calls to be more likely on the inside part of the heart zone (and indeed, that seems to play a small role), but evidently, umpires’ bias toward right-handed batters and toward the right-hand side of the heart zone overpowers any potential bias toward the inside third.
If you split the data up by platoon matchups, you’ll see that heart zone balls are much more common in righty-on-righty faceoffs than any other. However, if you remove sinkers from the data set, that effect disappears. All that remains is the overall bias toward righties.
Game State
In-Zone Balls by Game State
| Game State |
Heart Zone Ball Rate+ |
In-Zone Shadow Zone Ball Rate+ |
| Even Count |
83 |
93 |
| Batter Ahead |
71 |
81 |
| Batter Behind |
277 |
160 |
|
| No Outs |
94 |
98 |
| One Out |
104 |
101 |
| Two Out |
103 |
101 |
|
| No Runners |
85 |
95 |
| Runner(s) On Base |
124 |
108 |
| RISP |
123 |
108 |
|
| Extra Innings |
133 |
113 |
Data via Baseball Savant
When it comes to situational factors, we tend to see the same patterns in the heart zone and the IZSZ. However, the effects are more pronounced on heart zone pitches. For example, umpires call fewer in-zone balls in hitter’s counts, fewer in-zone balls with no outs, and fewer in-zone balls when the bases are empty. Conversely, they call more in-zone balls in extra innings. These effects are visible in both the heart zone and the IZSZ, but they’re more exaggerated over the heart of the plate. It makes a certain amount of sense. These factors have more to do with the plate umpire’s (conscious and subconscious) decision-making. The closer a pitch gets to the center of the plate, the bigger a role psychological factors are going to play compared to pitch characteristics or catcher framing.
Interestingly, the single best predictor of whether or not an in-zone pitch will be called a ball is if the catcher doesn’t catch it. Over the past five years, IZSZ “wild pitches” and passed balls have been about four times more likely to be called a ball than the average IZSZ take. In that same time frame, heart zone “wild pitches” and passed balls have been about 34 times more likely to be called a ball than the average heart zone take. Umpires are only human, and they can be distracted by a wild pitch/passed ball as much as any of us:
Individual Players
Over the past three seasons (in which heart zone ball rates have kept relatively stable), the league leader in this particular stat is Tyler Rogers. Among 175 pitchers who have gotten at least 250 takes in the heart zone, Rogers leads the way with a 3.6% called ball rate. The next closest pitcher is José Ureña at 2.4%, while Jorge López is the only other arm with a heart zone ball rate over 2%. The league average since 2021 is a mere 0.74%, while the median (min. 250 pitches) is 0.61%.
Unsurprisingly, the sinker is the primary offering from each of this trio’s three members. Rogers pounds the heart zone with his submarine sinker, which he throws more than 50% of the time. Given his funky delivery, it’s no wonder he gives umpires trouble. López doesn’t throw his sinker as often as Rogers, but he throws much harder, and he faces a higher percentage of right-handed batters. Six of his eight heart zone balls came against righties, and six of eight clocked in at 95 mph or higher. Ureña is the most puzzling inclusion. He added a ton of arm-side run to his sinker last season, but all six of his heart zone balls actually came in 2021 and ’22. Moreover, only one came on a sinker. Perhaps we can chalk this one up to small sample size weirdness. After all, there’s only so much we can glean about heart zone balls from individual players.
Ultimately, there is far more research one could perform on the topic of missed calls over the heart of the plate. I’m still curious why umpires call more heart zone balls on sinkers, more heart zone balls on the first base side of the plate, and more heart zone balls to right-handed hitters. The effect of catcher framing is another area for further exploration. Like I said, I found more patterns here than I knew what to do with. Thank you for letting me dump them all on you.
Source
https://blogs.fangraphs.com/quit-calling-balls-in-my-heart-zone/
