Joe Nicholson and Jerome Miron-USA TODAY Sports
Season one of One Tree Hill is a perfect season of television, and I will not be entertaining arguments to the contrary. In it we meet Nathan and Lucas Scott, the sons of hometown basketball hero, Dan Scott, who runs a local car dealership. Nathan was raised in the traditional nuclear family structure by Dan and his college sweetheart and wife. Lucas was raised in a single-parent household by his mother, Dan’s high school sweetheart. Despite sourcing their foundational genetic material from the same DNA pool, Nathan and Lucas are depicted at odds with one another in several key ways. Nathan is his father’s golden child and characterized as hyper competitive, entitled, and emotionally stunted; Lucas receives no acknowledgement from Dan and skews more intellectual, reserved, and empathetic. Both are super good at basketball and both crave the approval of their father. Nathan seemingly has it all, but presents as lonely and ill at ease in his environment. Lucas drew the short straw, but is mostly content and supported by several meaningful relationships.
The whole concept is a pretty straightforward exercise in nature vs. nurture, and if you haven’t seen One Tree Hill, don’t worry, I haven’t spoiled anything; this is all part of the show’s initial setup in the pilot episode. What the viewer is intended to puzzle out as the season unfolds is how much of Nathan’s arrogance and aggression is a reaction to his surroundings and how much is an inherent part of his character. And on the other hand, can Lucas, against his father’s wishes, learn to thrive in new surroundings as he steps into the spotlight of varsity basketball? Or is he more naturally suited to exist in the shadows?
I recently read almost six years of scouting reports, statistical breakdowns, and interviews covering two prospects from the 2018 MLB draft in an attempt to to understand the how and why of each player’s career arc. More on that later, but for now, I want to emphasize how much easier it is to analyze a teen soap opera. And it’s not that the scouting reports were unclear, or that the statistical analysis was misleading, or that the players misrepresented themselves in interviews. It’s that taking 18- to 22-year-olds and turning them into big leaguers is a hard thing to do under the best of circumstances.
Part way through that first season of One Tree Hill, Nathan files for emancipation from his parents to escape the abusive and domineering environment cultivated by his father, and he starts a redemption arc by re-shaping his character away from Dan’s influence. It serves as a pretty clear declaration of which son landed in the better situation and how much that drove his prior behavior. But player development isn’t a scripted narrative, drawing heavily on high school stereotypes, with a nice, tidy season finale.
Every player development system has a lot of moving parts and every player’s development has a lot of crucial nuance and context. This piece is going to draw some broad conclusions about each organization’s ability to draft and develop players, but I don’t want to ignore the variance created by things like staff turnover, facilities upgrades, technology acquisition, and the players’ autonomy throughout the entire process.
Last week, I evaluated teams on their ability to maximize talent at the big league level, talent they acquired via trade or free agency. This was an extension of research from a prior piece comparing the Angels and Dodgers as organizations. In that piece, I also compared the two teams’ ability to get major league production from the players in their respective farm systems. Now the moment has come to extend that analysis to the rest of the league and learn which teams, from a macro perspective, tend to get the largest contributions from their farmhands.
The theory behind the methodology is to compare the expectations for a minor league prospect to the reality of what that player becomes. The proxy for a player’s expected outcome is the Future Value (FV) grade assigned to the player when he enters a team’s system, either by the draft or in a trade. The earliest grade possible is used to capture the outlook on a player before the team exerts its influence. Since many prospects don’t work out, this analysis will focus on players with a 40 FV or higher, so that teams aren’t dinged for failing to develop players with long odds of making the majors.
With FV measuring expectations, the reality side of the comparison will be handled by WAR. But since counting stats make comparisons tricky, WAR will be converted to a rate stat – WAR per 600 PA for hitters and WAR per 600 batters faced for pitchers. Each organization’s evaluation is based only on what players did while they were members of the individual club with which they debuted because, after all, the goal is to measure each team’s ability to get major league contributions from the players it develops. For example, in this particular exercise, Andrés Giménez’s production would be factored into only the Mets’ evaluation because they developed him and he debuted with them before they traded him to the Guardians. Another example: Even though the Rays drafted and developed Joe Ryan, they would not get credit for his MLB production because they traded him to the Twins before he reached the majors.
As with prior analyses, we’ll gather data from 2018-2023 in order to amass a decently large sample, while keeping the window tight enough to prevent the signal from getting too muddied by the high turnover rates among player development staff and leadership. The points on the graph below represent the average WAR600 posted by each team’s 40+ FV pitching prospects, with lines extending outward to represent the standard error associated with that average as a way to show the variance of these values. This way we can understand how consistently teams’ pitching prospects are landing near their average outcome and get a more accurate view of the average as a range of likely outcomes.
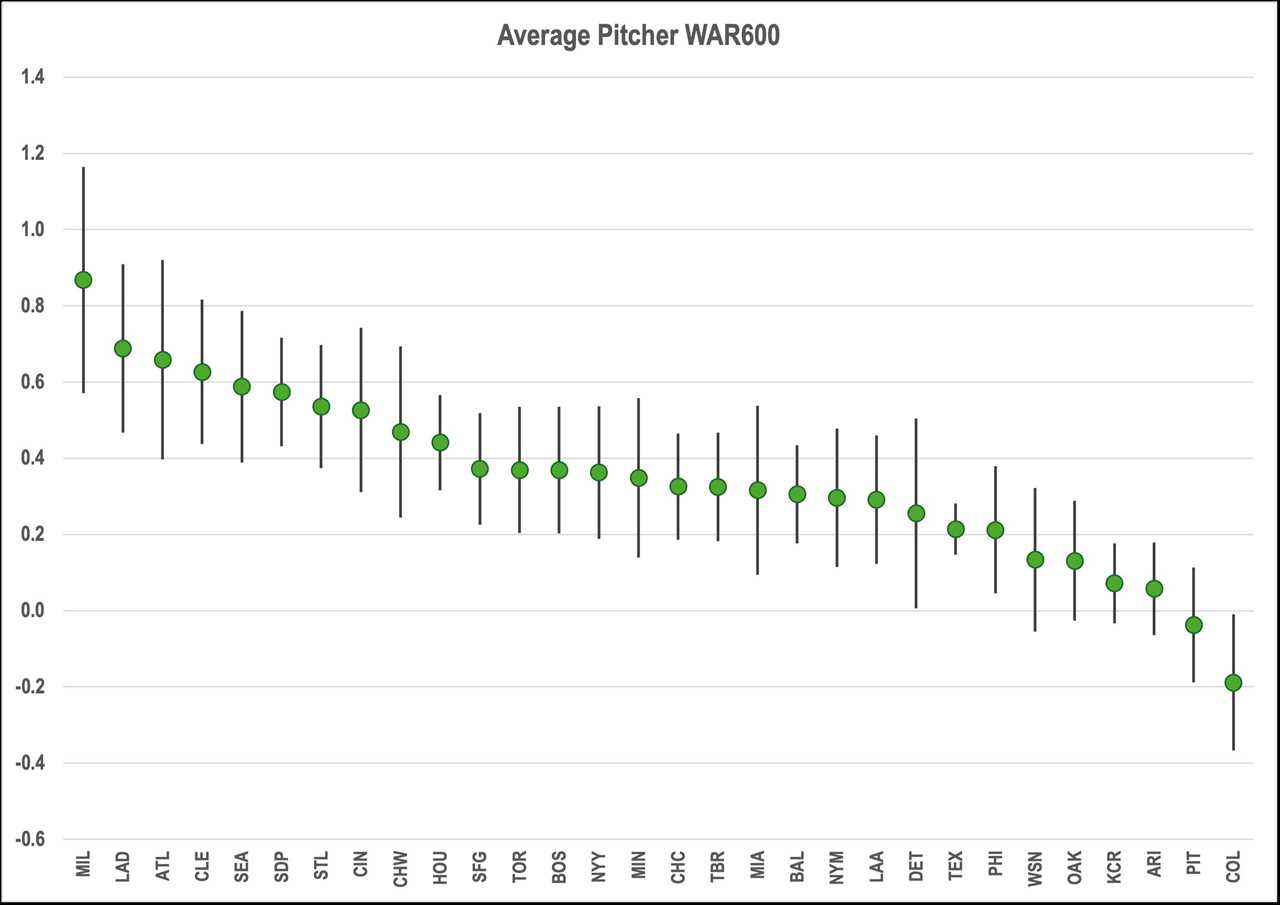
The ranges overlap quite a bit, indicating that a given player in most systems is working with roughly the same set of possible outcomes. But teams differ from one another enough to still make out which clubs tend to be more proficient and which ones trail the others. The Brewers have a comfortable lead over the second place Dodgers, while Colorado seems to think Rockies is short for rock bottom. Milwaukee and Los Angeles take different routes to their strong rankings. The Brewers have successfully developed fewer total pitchers than the Dodgers, but the ones they’ve hit on have really hit (Devin Williams, Corbin Burnes, Brandon Woodruff), whereas the Dodgers have benefitted from more of a volume play (Walker Buehler, Bobby Miller, Dustin May, Tony Gonsolin, Michael Grove, Gavin Stone).
To really get a feel for development we can lock in on how teams do with their 40 FV prospects specifically. By taking away the comparatively safer prospects with higher FV grades, we can focus on the players who are most dependent on their teams for coaching and resources and see which teams make the largest moves within the rankings.
Pitching Development Rankings
| Team |
Overall Rank |
40 FV Rank |
Rank Change |
| MIL |
1 |
1 |
0 |
| LAD |
2 |
2 |
0 |
| ATL |
3 |
12 |
-9 |
| CLE |
4 |
5 |
-1 |
| SEA |
5 |
16 |
-11 |
| SDP |
6 |
6 |
0 |
| STL |
7 |
8 |
-1 |
| CIN |
8 |
18 |
-10 |
| CHW |
9 |
15 |
-6 |
| HOU |
10 |
3 |
7 |
| SFG |
11 |
7 |
4 |
| TOR |
12 |
14 |
-2 |
| BOS |
13 |
11 |
2 |
| NYY |
14 |
9 |
5 |
| MIN |
15 |
4 |
11 |
| CHC |
16 |
19 |
-3 |
| TBR |
17 |
10 |
7 |
| MIA |
18 |
25 |
-7 |
| BAL |
19 |
17 |
2 |
| NYM |
20 |
26 |
-6 |
| LAA |
21 |
23 |
-2 |
| DET |
22 |
22 |
0 |
| TEX |
23 |
24 |
-1 |
| PHI |
24 |
13 |
11 |
| WSN |
25 |
20 |
5 |
| OAK |
26 |
29 |
-3 |
| KCR |
27 |
27 |
0 |
| ARI |
28 |
21 |
7 |
| PIT |
29 |
28 |
1 |
| COL |
30 |
30 |
0 |
Several above average seasons from Bailey Ober help Minnesota move 11 spots up the rankings, while Philadelphia gets a boost from some productive seasons in relief from Bailey Falter and Seranthony Domínguez, and multiple stellar seasons as a starter from Ranger Suárez. Meanwhile, the Mariners and Reds tumble down the rankings. Seattle’s highest producer in this category is Isaiah Campbell, who it turns out is, in fact, a real person. The Reds are led in this category by Graham Ashcraft, who is working on his third slightly below average season as a starter.
On the hitting side, there is a higher variance both within individual clubs and across the population of all teams.
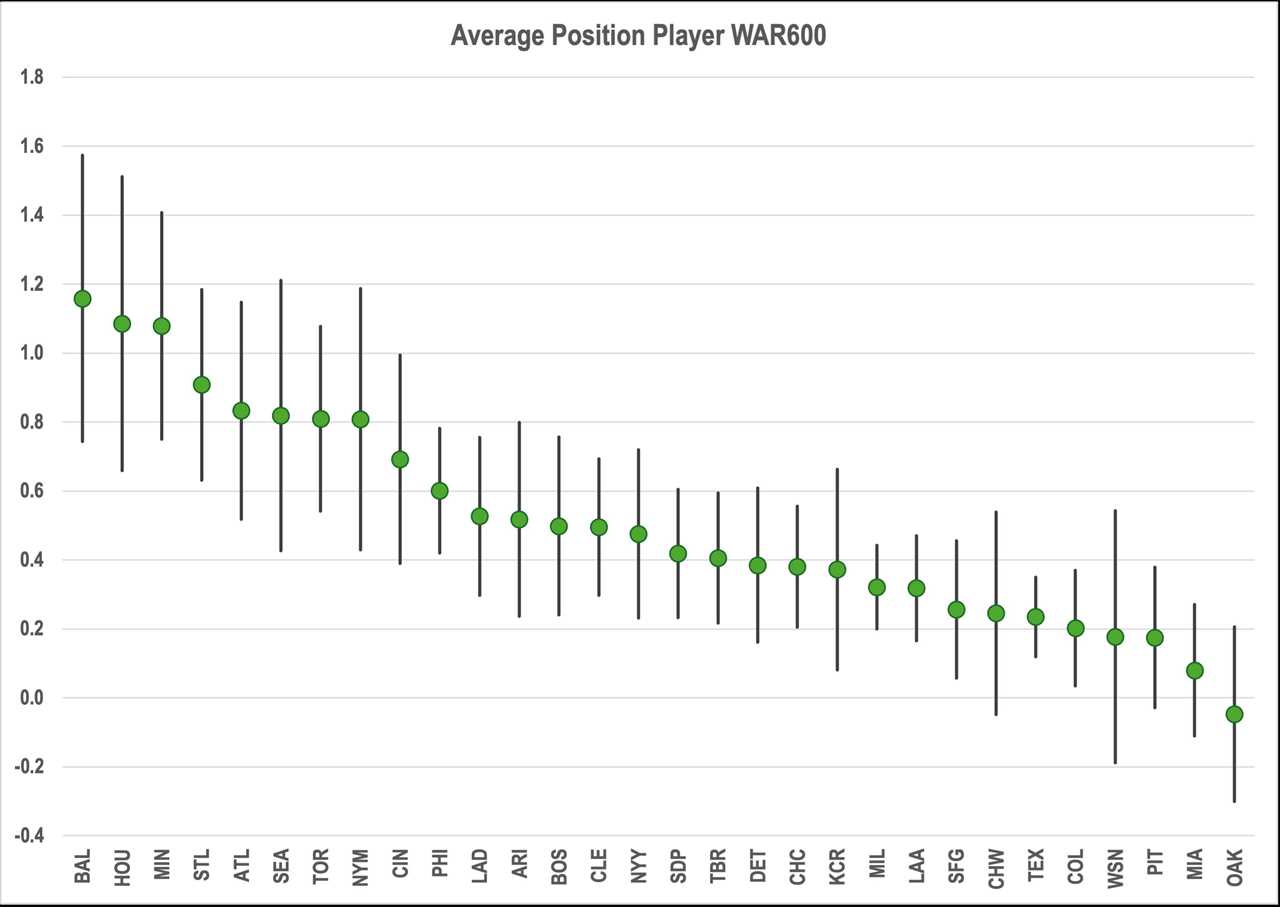
Baltimore, Minnesota, and Houston cluster near the top of the rankings, while Miami and Oakland bring up the rear. As we saw with pitching, some teams spread their production over several players, while others rely on one or two heavy hitters. The Twins own a high hit rate led by Royce Lewis, Mitch Garver, Edouard Julien, Ryan Jeffers, Luis Arraez, Nick Gordon, and Jake Cave, whereas the Braves owe their position in the rankings to Ronald Acuña Jr., Michael Harris II, Austin Riley, and Ozzie Albies.
Hitting Development Rankings
| Team |
Overall Rank |
40 FV Rank |
Rank Change |
| BAL |
1 |
4 |
-3 |
| HOU |
2 |
3 |
-1 |
| MIN |
3 |
1 |
2 |
| STL |
4 |
9 |
-5 |
| ATL |
5 |
6 |
-1 |
| SEA |
6 |
8 |
-2 |
| TOR |
7 |
5 |
2 |
| NYM |
8 |
2 |
6 |
| CIN |
9 |
18 |
-9 |
| PHI |
10 |
13 |
-3 |
| LAD |
11 |
14 |
-3 |
| ARI |
12 |
16 |
-4 |
| BOS |
13 |
11 |
2 |
| CLE |
14 |
28 |
-14 |
| NYY |
15 |
21 |
-6 |
| SDP |
16 |
25 |
-9 |
| TBR |
17 |
27 |
-10 |
| DET |
18 |
12 |
6 |
| CHC |
19 |
19 |
0 |
| KCR |
20 |
7 |
13 |
| MIL |
21 |
22 |
-1 |
| LAA |
22 |
10 |
12 |
| SFG |
23 |
29 |
-6 |
| CHW |
24 |
20 |
4 |
| TEX |
25 |
24 |
1 |
| COL |
26 |
17 |
9 |
| WSN |
27 |
30 |
-3 |
| PIT |
28 |
15 |
13 |
| MIA |
29 |
23 |
6 |
| OAK |
30 |
26 |
4 |
As you can see, Cleveland and Tampa Bay take a dive in the rankings when we limit the pool to 40 FV hitting prospects. Ernie Clement, with his 74 wRC+ and 0.4 WAR over 133 plate appearances (1.8 WAR600) in 2021, is the best the Guardians have to offer on this front. Meanwhile, Taylor Walls, who has yet to really break out, is the only positive producer for the Rays prospect contingent.
On the upside, the Royals, Angels, and Pirates all take a leap in the standings. Kansas City owes its surge to solid performances from Maikel Garcia and Michael Massey, plus a strong 2021 season from Nicky Lopez. Los Angeles is here because it saw strong defense and passable hitting from David Fletcher over his first few seasons in the bigs, a little over a season of positive production from Jared Walsh, and multiple seasons of league average or better hitting from Taylor Ward. Pittsburgh’s 13-place jump stems from productive seasons from Jack Suwinski, Jared Triolo, and the group’s headliner, Oneil Cruz. And although many of its excellent young hitters are well-regarded former first rounders, Baltimore remains highly ranked in the 40-FV category because of guys like Austin Hays and Cedric Mullins.
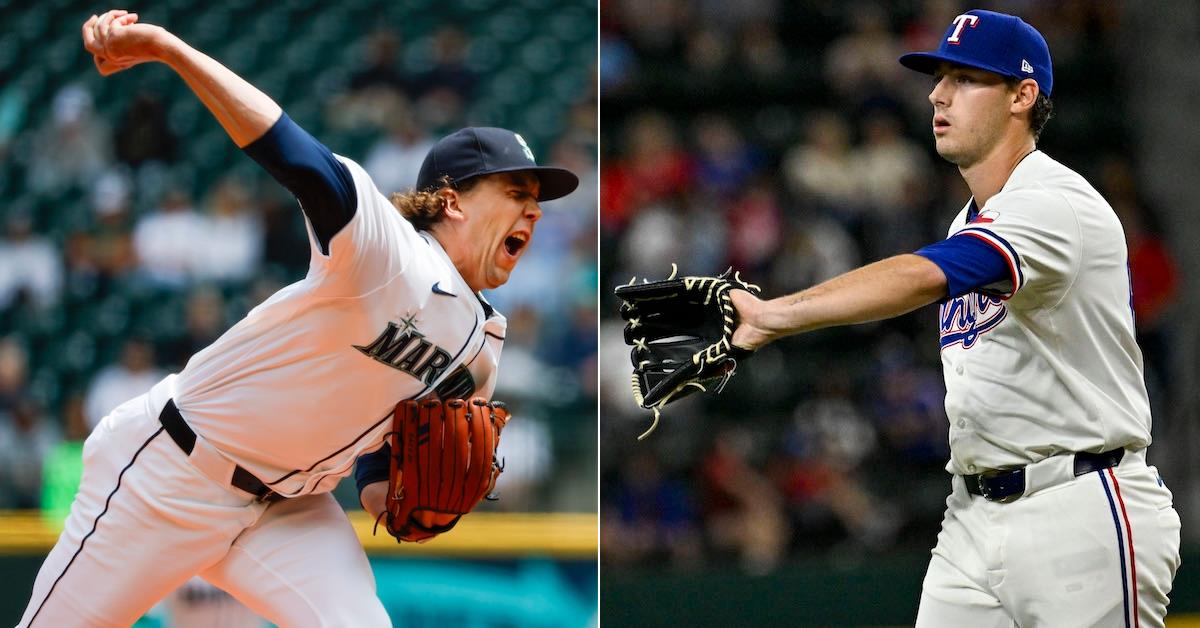
To understand how some teams arrive at stronger average outcomes than others, consider the divergent journeys of a pair of pitching prospects, both of whom were drafted in 2018. Logan Gilbert was selected 14th overall out of Stetson University by the Seattle Mariners (no. 5 in the pitching development rankings). The Texas Rangers (23rd on the pitching development list) took Cole Winn with the next pick out of Orange Lutheran High School. Both pitchers were characterized as having average to slightly above-average stuff that plays up due to some combination of command, deception, and tunneling. At the time, both threw a mid-90s fastball, a 12-6 curveball with a spiked grip, a more traditional slider, and a circle changeup to round out their arsenal.
Winn was touted as a polished high school product because of his fluid delivery and advanced command, but that command evaporated in his first full season as a pro. During the 2020 layoff, he worked with three Rangers pitching coaches to fine tune his arsenal using Rapsodo, Trackman, and Edgertronic cameras to understand how his pitches should feel and to find his release point consistently. In 2021, that work paid off and Winn’s command seemed to return, but after missing some time to manage his workload partway through the year, he returned with some sort of mechanics-specific amnesia. The problem persisted throughout 2022, and by mid 2023, his profile had changed from a projected middle-of-the-rotation starter to that of a multi-inning reliever. Winn made his major league debut on April 14 of this year, and thus far he’s appeared in 11 games, posting a 6.91 ERA (173 ERA-) over 14.1 innings.
Gilbert did not experience the same hiccups with his command as he embarked on his pro career, but he did spend time using technology to punch up his pitches. While at Seattle’s alternate site in 2020, Gilbert further developed his changeup, a pitch designed to tunnel with his fastball, by generating a ridiculous amount of drop late in the pitch’s trajectory. The revamped pitch was put to the test at the big league level in 2021, where Gilbert was forced to finish his development against major league hitters after Seattle’s rotation suffered a series of injuries. Though the changeup presented a nice complement to the fastball when it worked, Gilbert struggled to locate it, and thus used it only about 8% of the time. In 2022, he switched his grip from that of a circle changeup to a more traditional one, and his command of the pitch improved. And yet, toward the end of that season, he started workshopping a splitter with a couple of coaches and teammates before fully committing to it that offseason at Driveline. As Gilbert explained to David Laurila in early 2023, the splitter felt more natural than the changeup coming out of his hand because of his over-the-top delivery and long fingers. Gilbert made his way to the majors and continued to improve once he got there by maximizing the tools available to him; despite a lack of overwhelming velocity or elite stuff, he’s currently working on a third season with a better than average ERA-.
Gilbert and Winn entered pro ball on similar footing, but found themselves on different paths almost from the jump. Were their routes predetermined by their inherent skills and abilities, or did their environments and support systems play a role? Was Nathan destined to play the heel, or did he learn that role following his father’s footsteps? Did Lucas naturally settle into his role as an outcast, or did he land there after his father literally cast him aside?
At 6’6”, Gilbert owns a 4-inch height advantage over Winn and his release point benefits from the increased extension that comes from added height. Releasing the ball closer to the plate improves a pitcher’s perceived velocity. As of the time of this writing, no organization has the technique or technology for making arms longer, so the Rangers shouldn’t be faulted there. Gilbert also benefited from a couple of years of college development prior to the start of his pro career. Despite Winn’s “polished” status as a draftee, perhaps he’s on a longer timeline due to coming straight out of high school, which again, shouldn’t be a knock on the Rangers PD staff.
But in terms of variables within an organization’s control, we have quotes from both pitchers about using technology to improve, suggesting a level playing field there. However, the subtext skews things. Winn, along with a group of three coaches and some tech toys, fixed his command once, but he hasn’t been able to replicate that success since. But why? I doubt the Rangers threw away all of their high speed cameras. Of the coaches Winn mentions, one is now a roving pitching coordinator (which makes him less accessible), one is coaching Rookie ball (also not very accessible to an upper minors player), and the third is no longer with the organization. One possible interpretation is that the teachers Winn connected with best are gone, and his understanding of the original process they worked on together was not deep enough for him to replicate it on his own.
Gilbert, on the other hand, demonstrates a depth of knowledge as he speaks about the data he uses to develop. Back when he still threw a changeup, he didn’t just know its spin rate; he also knew its spin axis, how that should relate to the spin axis on his fastball, and how that impacted the changeup’s movement. “You put a little natural tilt on the ball, depending on where it comes out,” Gilbert told Laurila in 2022. “I’m trying to ride the fastball from up top, so if I throw my changeup in the same slot, it will naturally look like it’s headed down, even though the movement also has the horizontal axis. It will get the depth and fade just from that.” This suggests that the Mariners aren’t just talking at players with respect to pitch design, but teaching some of the theory behind it as well. Gilbert was confident enough to take an idea that he started spooling up with the team and work through the details during a winter session at Driveline. Some may give Driveline full credit for Gilbert’s splitter, but even in that scenario, the Mariners deserve some credit for developing a player to be comfortable with the technical side of pitching and for being open to their pitchers working with external coaches and trainers. Many teams consider players’ personal coaches more of a bugaboo than a helpmeet.
Maybe if Gilbert had been drafted by the Rangers, he still would have found a way to understand the ins and outs of pitch design and gone to an independent training facility to put what he learned into practice. Maybe if Winn had been drafted by the Mariners, they wouldn’t have been able to help him harness his command either. There’s no sure way to know what could have been. Maybe if Dan Scott needed a heart transplant and a dog ate his would-be replacement heart before the series premiere instead of in season six, both sons could have been spared years of work undoing his traumatic influence on their lives. That’s the world I’d like to exist for prospects. One where a dog inexplicably runs in and eats all the unnecessary obstacles, leaving just the productive tools that help shape them into better baseball players.
Source
https://blogs.fangraphs.com/the-dog-ate-my-prospect/
