Rob Schumacher/The Republic/USA TODAY NETWORK
Back when the Orioles signed Craig Kimbrel in December, Michael Baumann wrote something that has been rattling around my brain ever since: “But there are pitchers you need to get you through the regular season, and then there are pitchers who can win in the playoffs. And there is less overlap between the two than you might think.” Michael’s got a point. These days, there are super teams, super terrible teams, and fewer teams than ever in between. A league-average starting pitcher will do just fine most of the time. They’ll beat up on the White Sox and get beat up on by the Dodgers, and the universe will remain balanced. But if you ask a pitching staff without any true standouts to spend a whole playoff series silencing a lineup that starts off Acuña-Albies-Riley-Olson, you’re going to end up scooping them off the mound with a shovel.
This isn’t just the age of stratification; it’s also the age of the arm injury. Last year, both the Dodgers and Braves featured rotations that were among the best in baseball on paper, but real-life injuries proved to be their kryptonite. That’s why the hot new trend among super teams is rotational depth. Here’s what Ben Clemens said when the Braves traded for Chris Sale a few weeks after the Kimbrel deal: “If you’re looking at it exclusively through the lens of how Atlanta will line up in the 2024 playoffs, adding Sale starts to make more sense. I don’t think it’s reasonable to expect a full season out of him. The Braves are surely aware of that, though, and they have plenty of fifth starter types to fill in for him in the regular season.” Over at Baseball Prospectus, Craig Goldstein had the exact same thought: “the Braves are looking to have Sale healthy and effective at the right time of year, how much he misses on the way there is unlikely to matter much to them.”
These days, a super team’s goal is to be good enough to make it through the regular season with their aces in some sort of protective cocoon, then let those pitchers spread their gross bug wings in October, when the games really matter. Although the Dodgers come close, thanks to injuries to Clayton Kershaw, Walker Buehler, and Emmet Sheehan, no team exemplifies this strategy quite like the Rangers. Texas started the season with Jacob deGrom, Max Scherzer, Tyler Mahle, and Michael Lorenzen on the IL. As Ben wrote a few months ago, they’re built for the second half. Now, the team obviously didn’t want deGrom and Scherzer to get hurt last season, and Lorenzen should be back from his neck strain fairly soon. But they did sign Mahle with the understanding that his recovery from Tommy John surgery would keep him out until the second half of the season, around the time that deGrom and Scherzer were also expected to return (though Scherzer’s timetable now seems to have been moved up).
Knowing all this, I wondered whether the Rangers could be in line to set some sort of record. Could they be the team whose starting pitchers in October averaged the fewest starts during the regular season? There can’t have been that many playoff teams whose postseason rotation featured three frontline starters who barely pitched at all in the regular season. To check this, I used our postseason leaderboards to compare the numbers of postseason and regular season starts on the individual, team, and league level. What we’re looking for is Regular Season Starts Per Postseason Starter, or RSSPPS. It doesn’t exactly roll off the tongue unless you pronounce it “Recipes,” so that’s what we’ll do.
The data is only worth analyzing from 1903 onward, but before we dive into the numbers, I want to make special mention of 1884. That’s the year of the first “World Series,” when Old Hoss Radbourn started 75 regular season games for the Providence Grays, winning either 59 or 60. He then swept the New York Metropolitans all by himself, pitching three days in a row and allowing three runs (none of them earned) over 22 innings, giving the Grays the all-time high 75.0 Recipes. Those were the days.
As for the Rangers, let’s say that deGrom and Mahle come back a bit later than expected, starting just eight games apiece. However, in those eight games, they still look enough like their usual dominant selves that Bruce Bochy lines them up to start Wild Card Games 1 and 2. Let’s further say that the Rangers lose those two games, so neither Eovaldi or Gray gets a start. In that case, the Rangers as a team would average 8.0 Recipes.
In absolute terms, that wouldn’t be enough to set a record. The current record is 5.0, and it belongs to the 2019 A’s. That year, Sean Manaea got the start in the Wild Card Game, despite the fact that shoulder surgery kept him out until September. The Wild Card Game didn’t go well. He pitched two innings, allowing four runs on three homers, and the A’s lost to the Rays 5-1. One starting pitcher who made five regular season starts: An average of 5.0. It’s hard to imagine that the Rangers could challenge that record. With today’s best-of-three format in the Wild Card round, I just can’t see a team handing over the most important games of the year to two pitchers with fewer than 10 regular season starts between them.
However, teams that bombed out of the Wild Card round in just a game or two are skewing the results with their tiny sample size. If we set a minimum of five postseason games played (enough to get out of the Wild Card round), and we prorate each team’s total to put it in line with a 162-game season, the leaderboard looks much more likely to have room at the top for the Rangers.
Regular Season Starts Per Postseason Starter
| Year |
Team |
PS Games |
RSSPPS |
Prorated to 162 |
| 1952 |
Dodgers |
7 |
14.9 |
15.5 |
| 1976 |
Royals |
5 |
18.0 |
18.0 |
| 2020 |
Braves |
12 |
7.2 |
19.4 |
| 2019 |
Rays |
6 |
19.8 |
19.8 |
| 1999 |
Red Sox |
10 |
20.1 |
20.1 |
| 2020 |
Marlins |
5 |
7.8 |
21.1 |
| 1929 |
Athletics |
5 |
20.0 |
21.5 |
| 2020 |
Padres |
6 |
8.0 |
21.6 |
| 1941 |
Yankees |
5 |
20.8 |
21.6 |
| 2013 |
Athletics |
5 |
21.8 |
21.8 |
The 1952 World Series is in first place because Joe Black blew up the curve all by himself. During the regular season, Black went 15-4 for the Brooklyn Dodgers, making 54 of his 56 regular season appearances in relief. But with a 2.15 ERA, he was dominant enough to get the start three times in the Series. The 1976 Royals are in second place, led by relief ace Larry Gura. Like Black, Gura started two games in the regular season and two more in the playoffs. Although he went 0-2 against the Yankees in the ALCS, he would return to starting later in his career, earning Cy Young votes in three separate seasons.
The 2020 season provided enough weirdness for three teams to make the leaderboard. A.J. Minter, who has still never started a regular season game, served as an opener against Dodgers in Game 5 of the NLCS. Minter was the first player in MLB history to make his first start in the postseason, and though the Dodgers would go on to win, 7-3, he struck out seven of the 10 batters he faced, allowing just one hit over three scoreless innings. The Braves only planned to get an inning or so out of Minter, but he so thoroughly dominated Los Angeles that manager Brian Snitker let him cook. He closed out his appearance by striking out Joc Pederson, Chris Taylor, and Mookie Betts looking, for a three-up, three-down third inning.
Back to 2024, how many starts should we really expect for the Rangers, and where would they slot into our leaderboard? Let’s say that Nathan Eovaldi and Jon Gray stay healthy and effective into the postseason, making 30 regular season starts each. Scherzer comes back in late May, Mahle in July, and deGrom in August, making for 20, 15, and 10 starts respectively. If we further assume that those five pitchers get an equal number of postseason starts, then the Rangers postseasons starters would average 21 regular season starts, good for sixth on our leaderboard. And again, that’s if Eovaldi and Gray never miss a turn.
We can further skew the numbers by messing with the rotation. Let’s say the Rangers play in seven postseason games, with Eovaldi and Gray starting twice and the other three pitchers starting just once. In that case, the team would average 23.6 Recipes. They’d no longer be in the top 10, but they’d still rank 25th out of the 357 teams ever to play at least five postseason games. Assuming that all three pitchers actually come back and pitch in the postseason, that’s the scenario with the highest average I can possibly think of. If I had to guess, I’d say they’ll end up somewhere in the teens. Basically, unless they don’t get everyone back healthy enough to pitch in the postseason, or unless they don’t make it out of the Wild Card round (or into the playoffs at all), the Rangers will definitely end up very, very high on this list.
In pulling these numbers, I also looked at things on a league-wide basis in order to spot overall trends. As with the table above, the graph below is weighted and normalized to a 162-game season, so that short seasons like 1981, 1995, and 2020 don’t throw the curve.
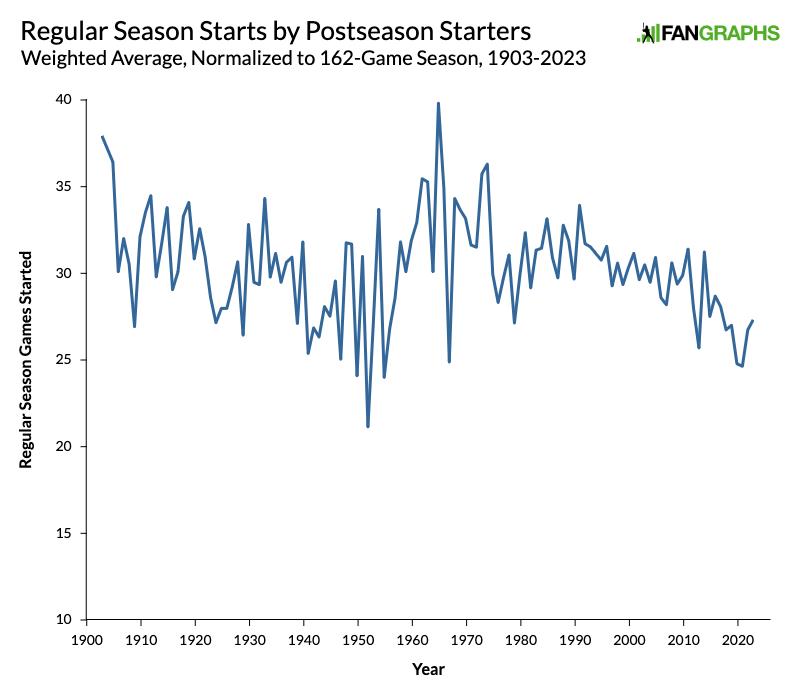
The 1965 World Series between the Dodgers and the Twins jumps out immediately, thanks to three starts each from Sandy Koufax, Mudcat Grant, and Jim Kaat, and two each by Don Drysdale and Claude Osteen. All five of those players started at least 39 regular season games. On the low end, those 1952 Dodgers stand out very sharply. In all, this is a very bumpy graph, especially until the start of the divisional era in 1969. The postseason is just a very small sample.
Still, the overall shape of the graph shows that for most of baseball history, the numbers haven’t changed that drastically. There was a bump in the 1960s, when pitching was so dominant that the league introduced rule changes to spark offense, and that’s likely not a coincidence. On a decade-by-decade basis, the averages have stayed between 26 and 31 starts, decreasing very gradually over time, with the ‘60s serving as a prominent outlier. The weirdness of the short 2020 season and the resulting injury bonanza in 2021 also pull the recent numbers down, but the overall shape of the graph makes plenty of sense. After all, even as starting pitching loads have lightened over time (especially in terms of innings), if your team wants to win enough to get to the postseason, you still need both quality and quantity from your best starters. We’re still figuring out the best way to model team depth because, quite simply, the health of your best players is super-duper important. If they’re not healthy enough to make it to the postseason, your team won’t be either. As for whether the Rangers have found a recipe for getting around that particular law, we’ll have to wait until October to find out.
Source
https://blogs.fangraphs.com/waiting-for-the-rangers-to-flip-the-switch/
