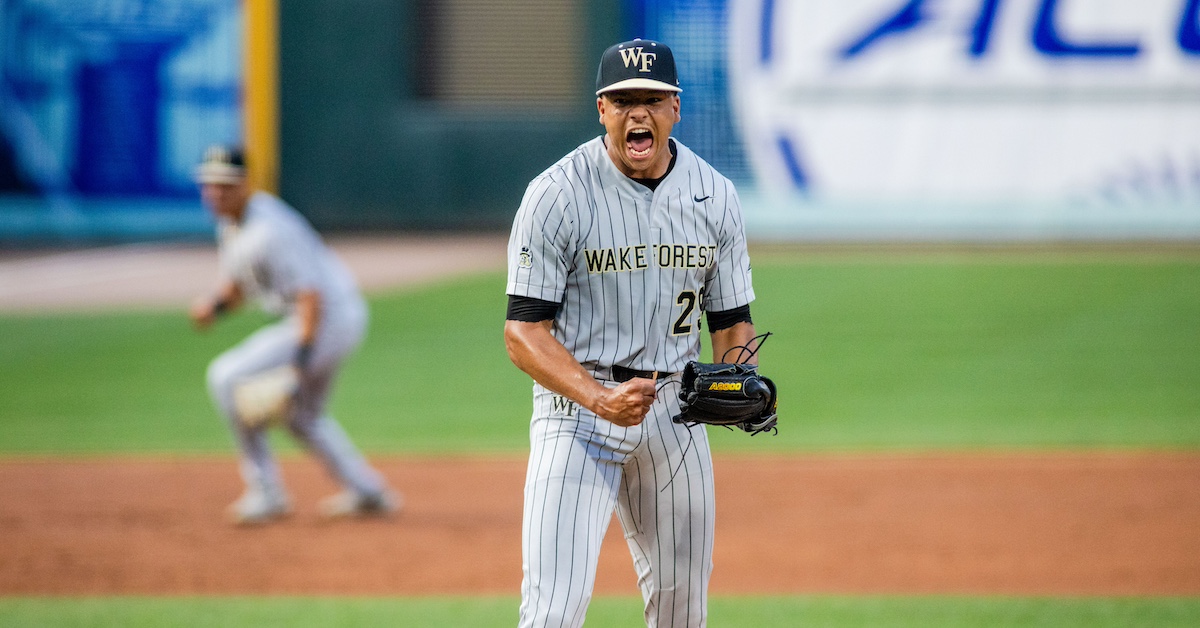
Scott Kinser-USA TODAY Sports
On Saturday afternoon, I sat down to watch the most important baseball game of the weekend: The Greenville Regional elimination game between East Carolina and Wake Forest. This game not only had NCAA Tournament survival on the line, it featured two of the top three college pitching prospects in this draft class: Wake’s Chase Burns and ECU’s Trey Yesavage.
In many respects, it mirrored last year’s College World Series semifinal between Wake and LSU, in which the two starting pitchers — Paul Skenes and Rhett Lowder — were the first two arms off the board in the draft. That was, for my money, the best baseball game played anywhere in 2023 and one of the best College World Series games of all time. Skenes and Lowder combined to allow five hits over 15 scoreless innings, and the only runs of the game were scored on the final play, a walk-off home run in the bottom of the 11th.
That was Mad Max: Fury Road, a bombastic, thrilling, and yet obviously virtuosic thriller that could not have been improved. ECU-Wake was more like Licorice Pizza: Clearly everyone involved was good at their craft, but the end result was weird and meandering and frustrating. Burns was a little disappointing; Yesavage was great, but after he was lifted in the eighth inning, ECU coach Cliff Godwin used seven pitchers to get the last five outs. In the meantime, Wake scored five runs in the top of the ninth to take a 6-4 lead, after which ECU struck back with five singles in the bottom of the ninth to walk it off.
It was a very jarring game; even as I could not take my eyes off that ninth inning, I felt immense regret for having spent my afternoon with these two clubs. No matter — no. 4 seed Evansville pulled an enormous upset to win the regional and advance, so we’ll be seeing neither of Wake or ECU until next February.
Burns did not have his best command on this enormous stage; he walked four in five innings and battled traffic all afternoon. It is praising with faint damnation to say that Burns “only” struck out seven Pirates in five innings, but it was his lowest strikeout total of the season and the first time since April 19 that he’d been held to fewer than 13 punchouts in a start.
Most crucially, he surrendered a three-run home run in the fifth inning to Dixon Williams, which put ECU into the driver’s seat that they later relinquished, then regained, in that dadaist ninth inning.
Good pitchers sometimes make bad pitches, and this was a stinker, a belt-high slider on the inside corner. Most good college hitters will do with such a pitch exactly as Williams did. But in the aftermath of Williams’ dinger, Teddy Cahill of Baseball America tweeted something that got me thinking. A disproportionately large number of the hits Burns has surrendered this year have gone for extra bases — the total ended up being 26 out of 62 by the time Burns’ season ended. “I’ve talked to some people about why that might be, but whatever the reason, it’s not insignificant that when he gives up hits, they tend to travel a long way,” Teddy said.
It got me thinking about the previous inning, in which Burns allowed back-to-back singles and ECU called for a sacrifice bunt. Now, there are very few people on the planet who have spent more time and energy than I have explaining to college baseball that the sacrifice bunt is usually not the percentage play. Moreover, think of how hard it is to bunt off a guy whose repertoire is the part of the lightsaber duel in The Empire Strikes Back where Darth Vader is using the Force to rip pipes off the wall and send them flying at Luke. Even if you get the bunt down, it’s hard to conjure a sacrifice fly off a guy who’s striking out 17 batters per nine innings.
But runners on first and second and nobody out is actually the only base-out state where putting on the sac bunt makes mathematical sense. And with Burns and Yesavage trading jabs and ECU trailing 1-0, even one run would make a massive difference. Finally, Burns had been bouncing his slider all afternoon; if a sac fly was too much to ask, a wild pitch did not seem out of the question.
Burns, as is so often the case, rendered the discussion moot by striking out the next three batters to end the inning. But the question remains: How do you approach a pitcher for whom contact is as inaccessible as the good cough medicine at CVS?
In other words, does Burns give up so many extra-base hits because batters are getting their money’s worth on those rare occasions they’re able to make contact?
This season, 22.6% of the hits Burns allowed went for home runs and 41.9% went for extra bases. How does that play in the majors? Well, since 2021, there have been 370 starting pitcher seasons of 100 or more innings; Burns’ 2024 campaign would’ve been 55th-highest in extra bases-to-hits ratio and 17th in home run-to-hit ratio.
Let’s put the professional comparison on the back burner for a minute, for a couple reasons. First, the run environments in college and the pros are wildly different. After more than a decade of constant rules and equipment changes, Division I baseball right now is playing like Coors Field in the 1990s, if Coors Field were on the moon and everyone was on even more steroids. The median team ERA is roughly two runs a game higher in Division I this year than in MLB.
Second, as much as I think a 100-plus-inning-a-year starter is an appropriate projected role for Burns, there’s some survivorship bias in limiting the sample to that group. I imagine there would be plenty of pitchers who give up even more extra-base hits per hit, but they get bounced out of the rotation — and indeed the league — before they have a chance to do so. So let’s compare Burns to his own cohort.
Since 2021, there have been six college pitchers drafted in the top 10: Jack Leiter and Kumar Rocker of Vanderbilt in 2021; Cade Horton of Oklahoma in 2022; and Skenes, Lowder, and Tennessee’s Chase Dollander in 2023. Burns is a near-lock to join them, as is Arkansas’ Hagen Smith. Yesavage ought to be the third college pitcher selected; the top 10 is a possibility for him, but not a certainty. Here’s how their numbers stacked up in their respective draft years:
Be Careful With that Leiter. You Don’t Want to Get Burns.
| Player |
K% |
XB/H |
HR/H |
BF |
SO |
H |
XBH |
HR |
| Jack Leiter |
41.6% |
.354 |
.292 |
430 |
179 |
48 |
17 |
14 |
| Kumar Rocker |
36.5% |
.373 |
.107 |
490 |
179 |
75 |
28 |
8 |
| Cade Horton |
27.5% |
.273 |
.145 |
233 |
64 |
55 |
15 |
8 |
| Paul Skenes |
45.2% |
.278 |
.097 |
462 |
209 |
72 |
20 |
7 |
| Rhett Lowder |
30.4% |
.311 |
.100 |
470 |
143 |
90 |
28 |
9 |
| Chase Dollander |
31.3% |
.410 |
.169 |
384 |
120 |
83 |
34 |
14 |
| Chase Burns |
48.8% |
.419 |
.226 |
391 |
191 |
62 |
26 |
14 |
| Hagen Smith |
48.6% |
.244 |
.122 |
331 |
161 |
41 |
10 |
5 |
| Trey Yesavage |
40.4% |
.245 |
.082 |
359 |
145 |
49 |
12 |
4 |
SOURCE: Baseball-Reference
A couple comments right away: Dollander was also slightly homer-prone last year, and God bless him, the Rockies drafted him. Horton is one of the weirder draft cases I can remember. He had Tommy John his first year of college and became that rarest of species: The draft-eligible redshirt freshman. Halfway through his draft year, Horton had spent more time at third base than in a college rotation, but he went absolutely berserk in the NCAA Tournament and pitched himself into the top 10. And Yesavage faced tough competition in the American Athletic Conference, but his numbers would probably not be as good as they are if he’d played in the SEC or ACC, as seven of the other eight pitchers on this list did.
I thought that mentioning Burns’ proclivity for extra-base hits was just the kind of nitpicking every top pitching prospect faces once scouts and writers get too many looks at them. Remember that concern trolling about Skenes’ fastball shape? Turns out that a man the size of a bear, who throws 100 mph with a plus-plus slider and Kevin Gausman’s splitter at the speed of Gausman’s fastball… he can get major league hitters out.
But no, Burns does give up a lot of extra-base hits, proportionally speaking. Skenes never had this problem. And the real concerning thing is that the only pitcher in this cohort who was even more homer-prone was Leiter. Like Burns, Leiter is a little smaller compared to Skenes (though the USS Nimitz is small compared to Skenes) with a lower-slot delivery. And his path to the majors has been quite a bit bumpier than most people anticipated.
Let’s go back to the professional game. I changed up the sample, using combined stats since 2020, and included all 524 pitchers who have thrown 100 total innings in the past five seasons. If there’s a relationship between strikeout rate and propensity to surrender extra-base hits as an outsize proportion of hits generally, I can’t find it. In a couple paragraphs you’re going to see a scatter plot with an almost perfectly horizontal fit line.
Nevertheless, here are both the top 10 and bottom 10 pitchers in baseball over the past five years in extra-base hits as a proportion of total hits allowed:
Top 10 and Bottom 10 in XB/H Rate
SOURCE: Baseball-Reference
Minimum 100 IP since 2020
Some good and bad pitchers on both lists — and the top of the strikeout rate leaderboard has XBH proportions all over the map — but generally good pitchers allow fewer extra-base hits as a proportion of total hits. So the thesis that hitters are trying to take advantage of their few opportunities for contact is bunk.
And for the record, if we’re looking for a reason why Burns is giving up so many extra-base hits while recording two-thirds of his outs by strikeout, I suspect it’s in the video I linked above. Burns doesn’t walk very many batters, but from time to time he’ll hang a slider, and college hitters only need to be lucky once.
A more granular investigation of Burns’ extra-base hit problem is a matter for a different article, and would probably require tools not available to the public. This is not the first time I’ve wished for the NCAA to introduce a searchable play-by-play pitch- and hit-tracking database. Maybe call it Baseball Scholar, as opposed to Baseball Savant.
Either way, I did find a few instances of starting pitchers who struck out a ton of batters but surrendered a disproportionate number of extra-base hits. Tyler Glasnow and Freddy Peralta are on the list, as is Trevor Bauer, though his repertoire bears almost no resemblance to Burns’:
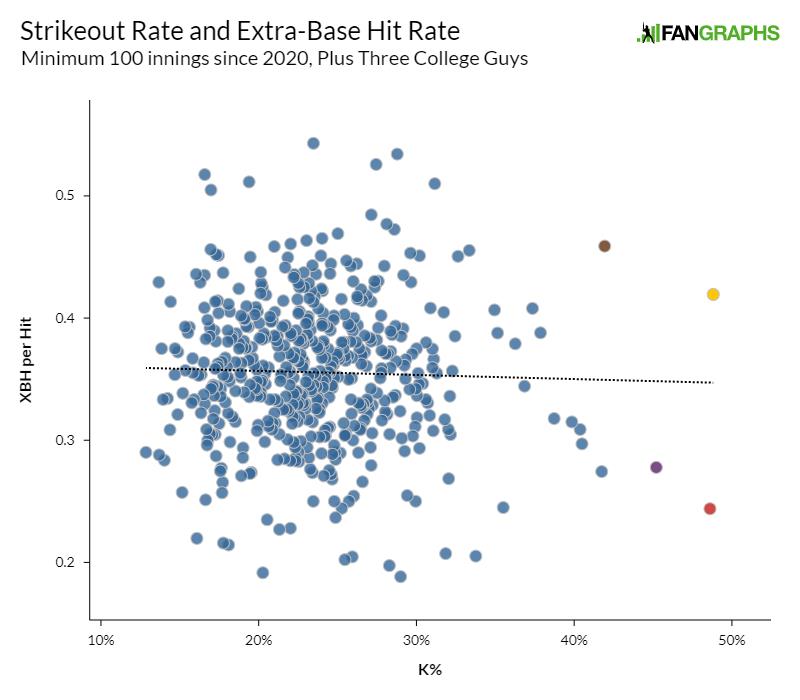
Here I’ve graphed the extra base hits-per-hit rate of pitchers since 2020 against their strikeout rates, and just for comparison I’ve included Burns, Skenes, and Smith in the data set. You shouldn’t have too much trouble finding them — they’re the three highest strikeout rates on the board — but just in case, I’ve highlighted Smith’s dot in red, Skenes’ in purple, and Burns’ in yellow.
Burns is also off the chart in K%, but also in allowing extra-base hits given his overall hit rate. Of the 549 MLB pitchers represented on this chart, 101 had 40% or more of their hits go for extra bases. Only one of those pitchers also struck out 38% or more of his opponents. That pitcher’s dot is the only one anywhere near Burns in both axes, and I’ve marked it in brown.
It’s Jacob deGrom.
Source
https://blogs.fangraphs.com/when-all-or-nothing-meets-all-or-nothing/
