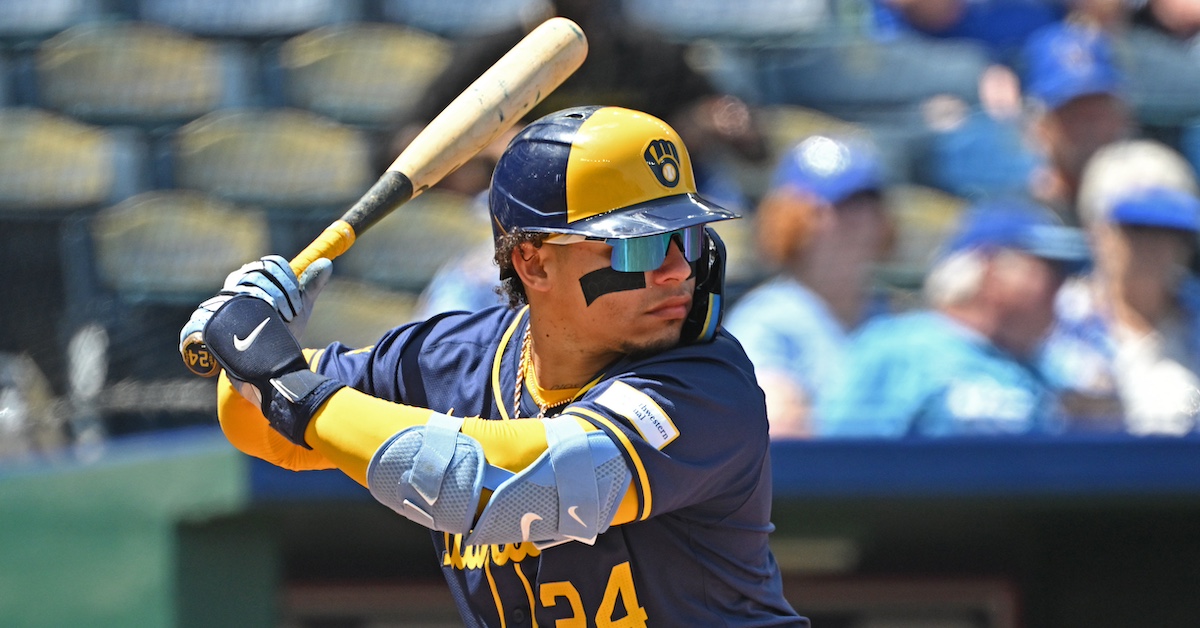
Peter Aiken-USA TODAY Sports
William Contreras stopped being an unheralded star a while ago. He was merely “the backup catcher” in Atlanta, but he smashed last year as the undisputed starter in Milwaukee and he’s backing it up with another spectacular season. He’s the face of one of Statcast’s new bat speed metrics. He’s a shoo-in All-Star and one of the betting favorites to win NL MVP. So this isn’t a “hey, have you heard he’s good?” article, because of course you have. The real question is, what has he changed this year?
Contreras’ standout skill is his thunderous raw power. He cracked 20 homers in just 376 plate appearances during his breakout 2022 and is one of the hardest swingers in the game. As you might expect, he has swing-and-miss issues, with his 13.4% swinging strike rate the price he pays for trying to crush everything he swings at. But that’s ok. His hard-hit rate, barrel rate, maximum exit velocities, and HR/FB rate are all gaudy.
Here’s the thing, though: While power might be his most obvious carrying tool, Contreras has quietly developed into much more than just a one-note power hitter. You can’t see it in the surface numbers – he’s walking about as much as he always has and striking out as frequently as he did last year – but he’s completely revamped his approach at the plate, and it’s downright sterling these days. In fact, maybe we should be talking less about how Contreras compares to Juan Soto in squared up contact, and more about how he compares to Soto in strike zone mastery.
We’re going to need some precise definitions here, so I’m going to go with Baseball Savant’s attack zone classification system to start. I think it’s a really helpful way of breaking down swing decisions. If you don’t need this refresher, nice! You can search for the phrase “definition maze” and get on with your reading.
But in case you do want to go over it again (and I hope you do), the “attack zone” methodology breaks the strike zone down into four sections. The heart zone is self-explanatory: cookies and near-cookies down the middle. The shadow zone is the fringes of the plate and the area just off of it. The chase zone is where the pitches that start as strikes but then bend end up; it’s so named because pitchers who throw there are attempting to induce a chase. The waste zone is so far from the strike zone that batters rarely ever swing at pitches that end up there. Here’s a visual representation:
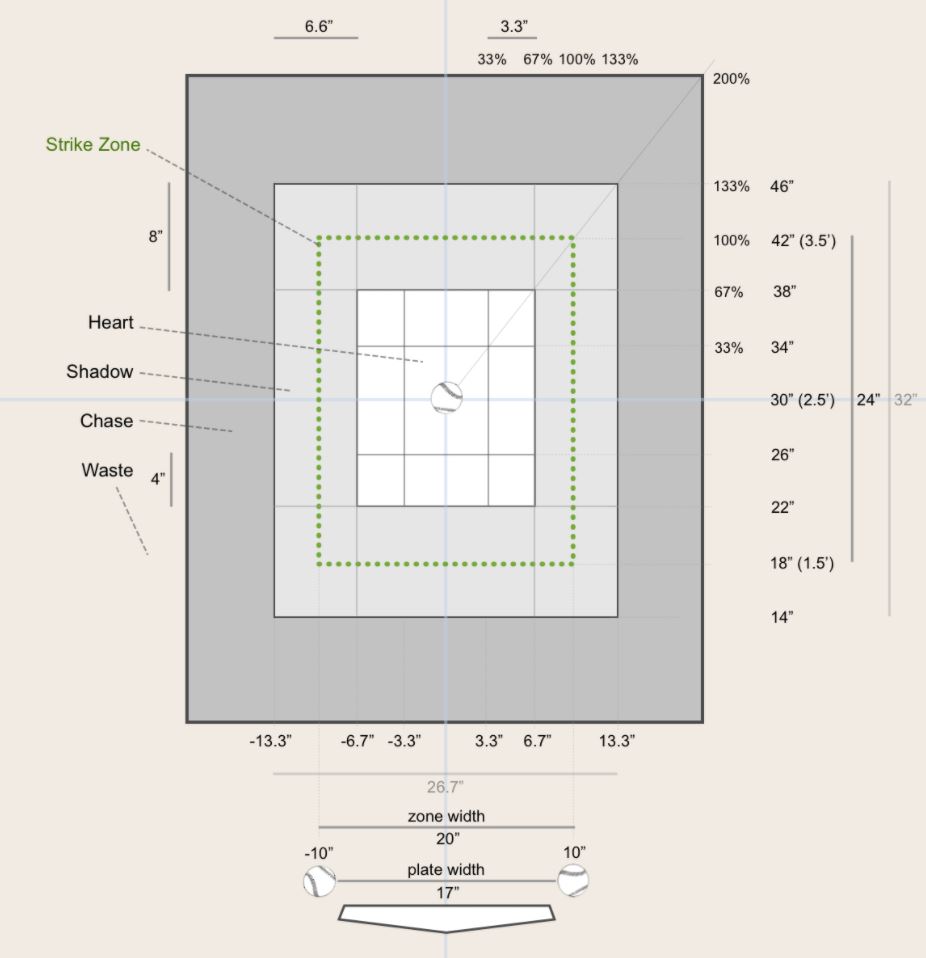
What I like most about this definition of the zone is how it simplifies analysis. Is it good to swing at a lot of strikes? I’m not sure, to be honest. Some of those might be painted in tough locations and in counts where the hitter would do better to wait for another pitch. Plenty of hitters who can’t lay off the low ball swing at sinkers they shouldn’t, even if they’re technically in the zone. But a swing at a pitch over the heart of the plate? Yeah, that’s probably a good idea.
Likewise, some swings at pitches that don’t cross the strike zone are nevertheless good. With two strikes, it’s wise to defend if a pitch is going to be close, and hitters don’t know the exact trajectory of the ball in flight, so lots of pitches look like potential strikes when swing decisions get made.
The value produced by each decision in each zone can help us think about it. Statcast records the change in run value for every pitch. Take a strike? Your team’s expected runs that inning go down. Hit a homer? They go up. Ground out in a 3-0 count? That one’s gonna hurt. Take a tough 3-2 pitch just off the plate? You’ll get tons of points for that.
Since Statcast records a location and run value for every pitch, we can split our data into eight buckets (swings and takes in each of the four zones). We can express them further in run value per 100 pitches, so that the numbers aren’t annoyingly small. That looks like this:
Swing and Take Values By Zone
|
Swing RV/100 |
Take RV/100 |
Gap |
| Heart |
0.4 |
-5.6 |
6.0 |
| Shadow |
-3.3 |
0.1 |
-3.4 |
| Chase |
-7.5 |
5.9 |
-13.4 |
| Waste |
-12.4 |
6.0 |
-18.4 |
In plain English, there are two obvious effects going on here. First, the closer the ball is to the heart of the zone, the more valuable a swing is. On the flip side, the farther the ball is from the heart of the zone, the better a take is. These two effects reach a rough equilibrium somewhere around the fringes of the plate, in the shadow zone. That’s where fine strike zone judgment matters most. If you split it into shadow-in and shadow-out, you can see that the breakdown is intuitive:
Swing and Take Values By Zone
|
Swing RV/100 |
Take RV/100 |
Gap |
| Shadow-In |
-2.5 |
-4.1 |
1.6 |
| Shadow-Out |
-4.6 |
3.6 |
-8.2 |
Obviously, the shadow-in zone is where you find “pitcher’s pitches,” in announcer parlance. They’re bad for the hitter whether they swing or not; it’s a matter of minimizing harm if you’re facing one of those well-located gems. This is where batters with great judgment rack up value. They swing at the ones that are barely in the zone and pass on the ones that barely aren’t. But it’s incredibly hard, and swing rates here tend to get smushed towards average anyway. So many of these pitches look like strikes, or are too close to take, or are close enough to a hitter’s nitro zone, that you can’t look at a high or low shadow zone swing rate and take much away.
Why did I make you walk through that strike zone definition maze with me? Because Contreras’ evolution at the plate is tied up in those zones. Here are a few obvious takeaways from the big picture: swing at pitches over the heart of the plate, don’t swing at pitches in the chase and waste zones. When something’s in the shadow zone, well, it depends. Here’s what Contreras has done over the past three seasons:
Contreras Swing Rates By Year
| Year |
Heart |
Shadow |
Chase |
Waste |
| 2022 |
72% |
47% |
26% |
6% |
| 2023 |
69% |
48% |
20% |
5% |
| 2024 |
80% |
53% |
17% |
3% |
| League Avg |
73% |
54% |
24% |
6% |
Uh, yeah, that’ll play. He used to swing at an average number of meatballs and chase a few too many bad pitches. Then in 2023, he showed restraint everywhere. In 2024, he’s swinging way more – but only at pitches in the heart of the zone. He’s attacking those with reckless abandon while chasing bad pitches less than ever.
That’s not normal. This isn’t a video game; everything is correlated. Generally, if you swing more frequently, you’ll swing more frequently at both no-doubt strikes and pitches that start out looking like strikes and end up in the chase zone. Swing rate is about judgment, but it’s also about intent, and it’s far easier to change intent than judgment.
Only, Contreras has done it. Last year, he was in the 29th percentile for heart swing rate and the 31st percentile for chase swing rate. In other words, his intent was to swing less than average. This year, he’s in the 83rd percentile for heart swing rate… and the 24th for chase swing rate. I’m not even sure how to categorize what he’s trying to do, because he’s going to town on hittable pitches and spitting on tough ones. Is “just be great” a way to describe intent?
Zoom in on the shadows of the strike zone, and the story hardly changes. He’s gotten more aggressive against the pitches that would clip the corners, and it’s cost him less than expected on pitches that miss by a hair:
Contreras Swing Rates By Year
| Year |
Heart |
Shadow-In |
Shadow-Out |
Chase |
Waste |
| 2022 |
72% |
52% |
43% |
26% |
6% |
| 2023 |
69% |
55% |
39% |
20% |
5% |
| 2024 |
80% |
63% |
43% |
17% |
3% |
| League Avg |
73% |
61% |
45% |
24% |
6% |
That’s impressive, but I think Contreras’ change is even more impressive than these raw numbers would suggest. If you’re into weird acronyms, you’ll love the next stat I’m coming at you with: ISOBIP. That’s isolated power per ball in play, an easy way of measuring damage on contact. The differences are more important than the magnitude here. You can see that Contreras’ power is best high in the zone, and then in a band headed from up-and-away to down-and-in:
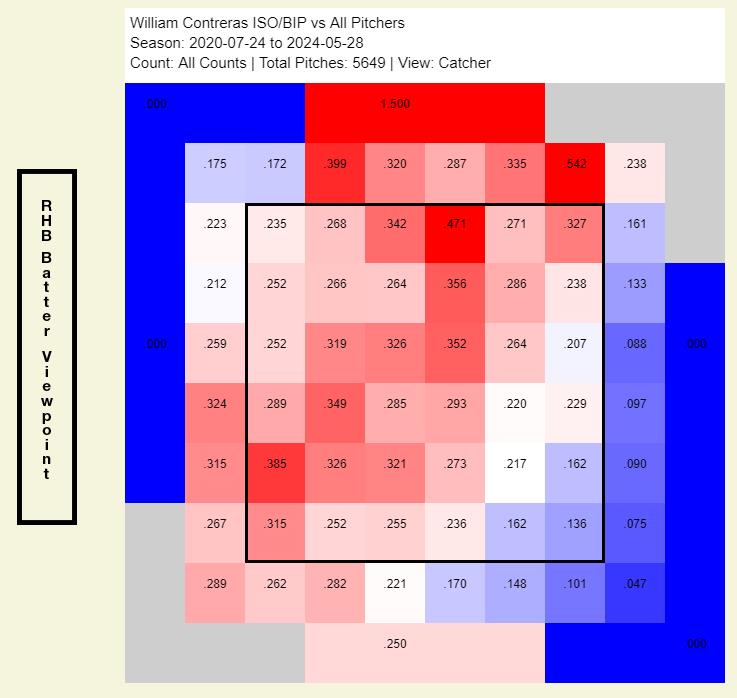
He doesn’t get much power when pitchers handcuff him high and tight, and like basically everyone in baseball, he has trouble covering the low-and-away pitch. Forget hearts and shadows; he wants to smash high pitches, drop the bat head on low-and-inside pitches, and stay away from everything else. It turns out, the attack zone numbers we’re seeing are just representations of that. Here are his swings in 2023:
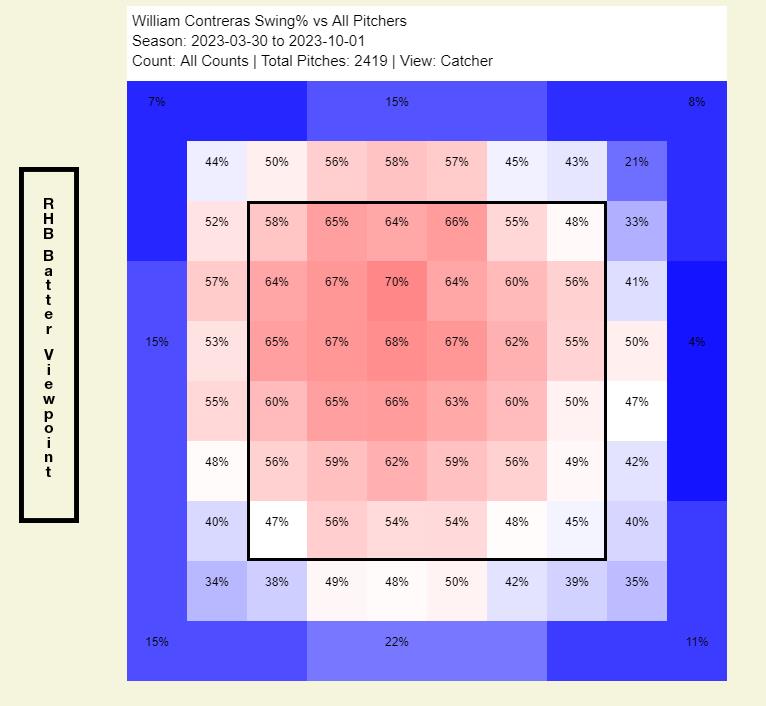
That’s pretty much an average swing heat map. It’s at its darkest red in the place he does a lot of damage, and it bleeds down from there. He’s swinging about as often at pitches in the lower third as in the upper third, which seems strange for a high-ball hitter, but hey, hitting is hard.
Now, let’s look at 2024:
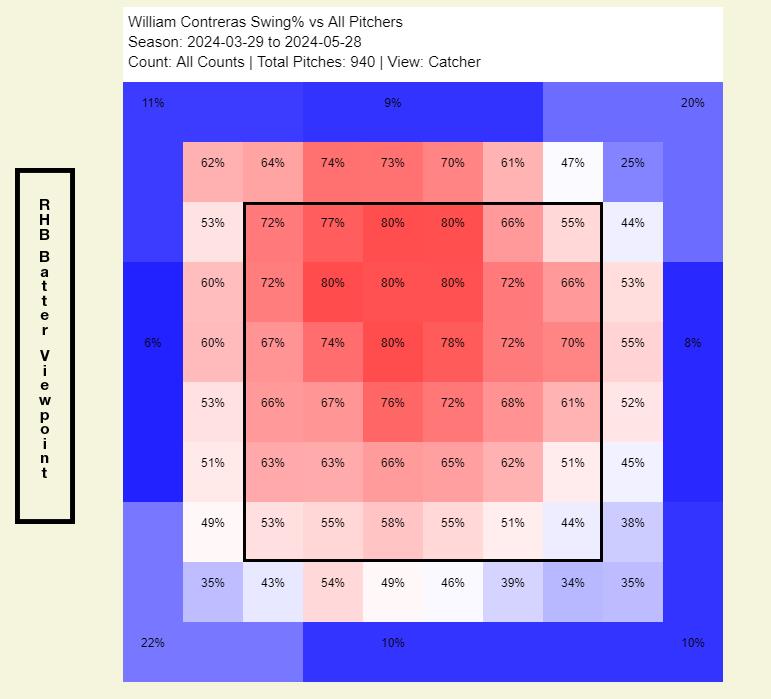
Yeah, that’ll play. His happy zone is now dark red – 80% swings at pitches he mashes. Meanwhile, he’s prioritizing high pitches over low pitches across the board. His swing rate in the upper third of the zone has jumped from 65% to 80%, while his lower-third rate has barely budged. Meanwhile, he’s completely given up on chasing pitches below the strike zone. Given that those are largely secondary pitches with downward break, and given that he wasn’t much of a low-ball hitter to begin with, that’s a spectacularly valuable adjustment.
It’s tempting to look at the great leap forward Contreras has taken in 2024 and start rationalizing. He’s not walking more or striking out less. He’s running a .385 BABIP. Surely, this is a hot streak that will even out. But I think that’s wrong. The surface stats are hiding a monumental change under the hood. He’s just gotten more skilled at identifying and attacking pitches. Maybe he won’t quite keep up his current pace, but this is what a great hitter looks like: elite bat speed, great ability to square the ball up, and an advanced ability to attack hittable pitches without over-swinging at bad ones.
Source
https://blogs.fangraphs.com/william-the-strike-zone-conqueror/
