
Steven Bisig-USA TODAY Sports
In the course of researching the haphazard nature of JP Sears’ fastball command for my blog Pitch Plots, I realized I was missing the answer to a fundamental question: Why does the ball go where it goes?
Specifically, I had no idea which variables determine the physical location where a pitch crosses home plate. My first guesses revealed nothing: a combination of velocity, extension, spin, and release height had no relationship to a pitch’s eventual location. If it wasn’t any of these factors, what could Sears change to throw his fastball to better locations?
I was missing the key variable: the release trajectory. Trajectory, as defined here, is not just release height and width but also the vertical and horizontal release angles of the pitch, which are not widely available to the public on a pitch-by-pitch basis.
The release trajectory, it turns out, explains nearly everything about the ultimate location of a pitch.
Even without incorporating any information about what happens after the ball is released — the spin, the speed, the movement, the air — release angles, alongside release height and width, can tell us with almost perfect certainty where a pitch within a given pitch type will end up.
With this finding, we can do a better job of quantifying command. Location+ and PitchingBot Command — two command models hosted here at FanGraphs — reveal a lot about how good pitchers are at avoiding walks, but they take a large sample to become reliable. Both models rely on count-based location outcomes, and it takes a few hundred pitches to gather enough data to meaningfully evaluate locations in each count. They also aren’t particularly “sticky” from year to year, meaning that a pitcher’s 2023 Location+ doesn’t reveal much about what it might be in 2024. What these models capture, it seems, might be fleeting.
Many have attempted to quantify command over the past two decades. Eno Sarris went through the history of these attempts in his 2018 article debuting the STATS LLC metric Command+. In the article, he suggested that it might be impossible to measure the true intent of a pitcher. Among the more ambitious efforts to do so was COMMANDf/x, which tried to capture where a catcher’s mitt was set up prior to the delivery of the pitch. But its initial attempts produced questionable results. One limitation is the nature of catcher targets: It’s true that sometimes the catcher is set up exactly where he wants the pitcher to throw, but just as often the catcher may gesture toward the intended target before setting up middle, or simply hold his glove below the zone until the pitch begins its flight path. Novel technological approaches are opening up new pathways for pre-pitch glove tracking, but the aforementioned concerns remain.
Release trajectories, by comparison, reliably provide information about pitcher intent like no other variable in the public sphere. In theory, pitchers who have better command should have trajectories — vertical and horizontal release angle pairs — that cluster tightly in specific locations. My statistic — the Kirby Index, named for Mariners starting pitcher George Kirby — will be the first public metric that tests this theory.
For simplicity’s sake, the Kirby Index measures command of a single pitch: the four-seam fastball. But fastballs also present additional complications: Four-seamers can be up, down, in, away, and anything in between.
The Kirby Index does not attempt to account for these complexities, but even with significant limitations, it is still “stickier” year-to-year than the two FanGraphs command models. I hope the Kirby Index will be just the first of many efforts to harness the immense power of release trajectories to better understand the elusive concept of pitcher command.
…
When I went looking for the missing variable, I had two preliminary theories: Either environmental factors were at play, or there was something in non-public biomechanical data that could explain pitch locations.
Enter release angles. Release angles — both vertical and horizontal — are not a widely available statistic. Many Division I college teams measure it using Trackman units, but that data is stored in-house. Major league teams use fancier tracking technology than college teams and likely have their own internal measurements that capture not just release angles but also ball trajectory on a granular, millisecond-by-millisecond level. Alex Chamberlain started offering aggregated VRA and HRA calculations on his indispensable Pitch Leaderboard in February, but other than a partial VRA leaderboard posted by Andrew Baggarly in a 2021 story about Tyler Rogers, major league VRA has not been discussed much in the public sphere.
In academia, at least one statistics department has considered the idea. In a 2022 article titled “SEAM methodology for context-rich player matchup evaluations,” University of Illinois statistics professors Julia Wapner, David Dalpiaz and Daniel J. Eck modeled matchups with a slew of Statcast variables as well as internally calculated vertical and horizontal release angles. In that article, they provided a “rudimentary” way to calculate implied VRA using the same three-dimensional velocity and acceleration figures that are used in vertical approach angle (VAA) calculations:
I began with their equations. Then, after consulting with Alex Chamberlain (who published groundbreaking research on vertical approach angles for FanGraphs in 2021 and 2022 and horizontal approach angles in 2023), I made further tweaks to the implied release angle formulas to account for acceleration and extension in all three physical dimensions.
After calculating vertical and horizontal release angles for all four-seam fastballs thrown during the 2023 season, I dialed up a machine learning tool that excels at making predictions with large available samples of data: RandomForestRegressor.
The most important thing to know about how RandomForestRegressor works is that the model essentially makes hundreds of different predictions based on “decision trees.” Afterwards, it averages the results of those predictions to create a master prediction. To do so, it develops the optimal model on a “training” set — 75% of the dataset, in this case — using bootstrapping techniques (basically, many trials and many errors); once the model is formed, it deploys the model on a “test” set — the other 25% of the dataset — ensuring that the model isn’t just making good predictions because it’s already seen that data. Use of this technique depends on a large dataset.
Thankfully, this dataset is huge. There were just under 230,000 four-seam fastballs thrown during the 2023 season, meaning I could train my model on hundreds of thousands of fastballs and still have a large dataset left over for testing.
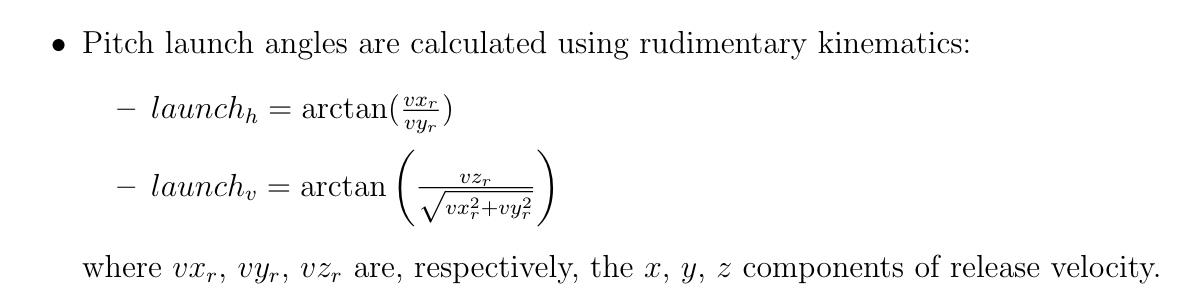
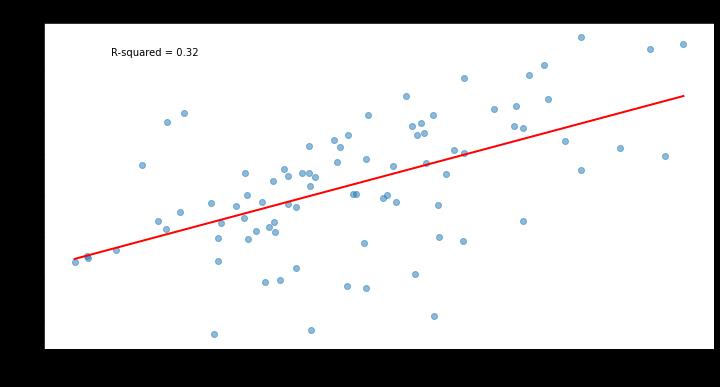
To start, I looked at our first model, which included everything besides release angles — spin, extension, velocity, release height, and release width. Here’s how it did, with a 45-degree dotted line included on the plot to show what a perfect relationship would look like:
The R-squared between the predicted values and the actual values for vertical locations was 0.06; for horizontal locations, it was 0.05. In short, it did a terrible job of predicting fastball locations — even with all of that information at its disposal.
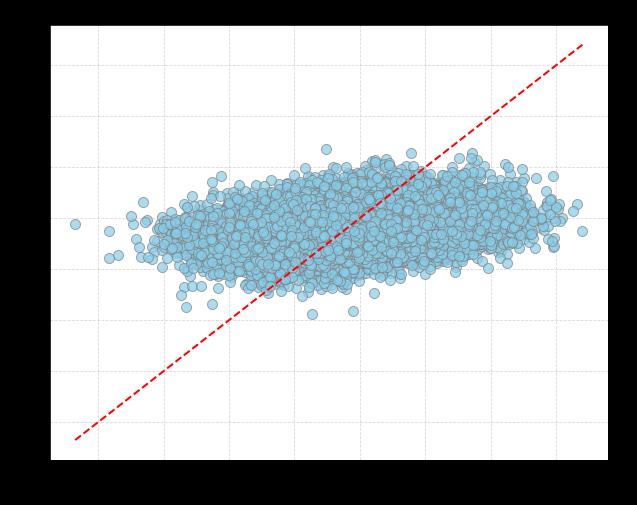
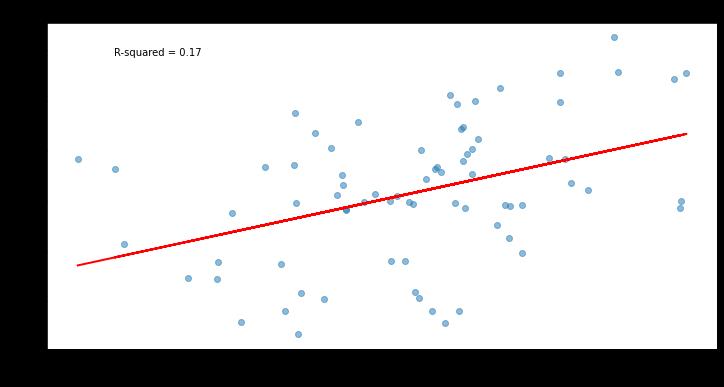
I then removed everything from the model besides release height and width, and added vertical and horizontal release angles. Here’s how the model did at predicting vertical and horizontal locations using only release trajectories, omitting everything else about what happened to the ball after release:
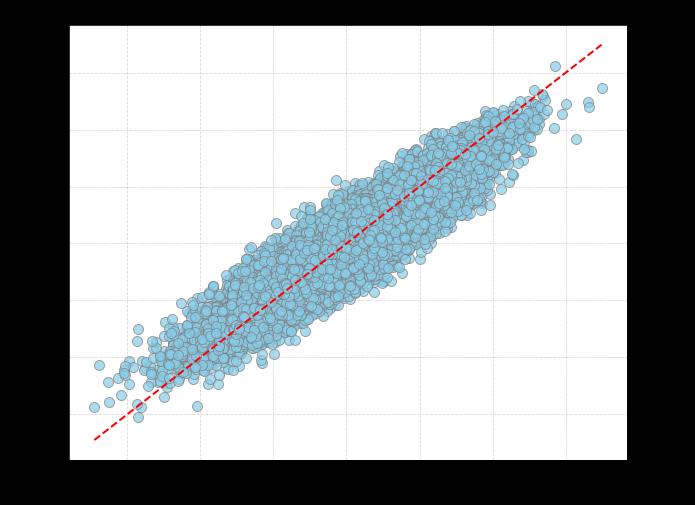
The R-squared between the actual and predicted values was 0.92 for vertical pitch locations and 0.85 for horizontal pitch locations, meaning that the release trajectory explained almost all of the variation in the ultimate location of four-seam fastballs.
This, to me, was a surprising outcome: Nearly everything about the eventual location of the pitch 60.5 feet away can be known before the ball is even released. And if release angles are this powerful at explaining fastball location on a pitch-by-pitch level, could this information be leveraged to quantify a pitcher’s fastball command?
…
Command, historically, is the most difficult element of a pitcher’s arsenal to quantify. At this point, there are a number of Stuff models out there, all of which do a good job at describing the physical characteristics of pitches. Because they look at physical characteristics and not outcomes, they stabilize quickly. In other words, they give us useful information fast, faster than something like FIP or ERA might.
Release trajectories allow for an opportunity to develop a command model that matches the Stuff models in their ability to stabilize quickly. If these trajectories capture most of the information about the location of a pitch before the pitcher has released the ball, they in theory can tell us a lot in a short amount of time about the ability for pitchers to hit their spots. The question, then, becomes how to leverage this data to quantify fastball command — and which outcome-based statistics are an accurate reflection of this elusive concept.
On the first part of the question: A crude way to harness release trajectories for measuring command would be to first calculate the standard deviation of the four main determinants of location — vertical release angle, horizontal release angle, vertical release point, and horizontal release point — sort these standard deviations into percentiles, and weigh each variable based on the importance each has to the ultimate location of the pitch. This spits out a single command figure, which I will call the Kirby Index, named after George Kirby, who ranked first in the Kirby Index in 2022, second in 2023, and first during the 2024 season until a bizarre start at Coors. (The mechanics of the Kirby Index can be seen on my Github page.)
(As an aside: Calculating the density of actual pitch locations would result in very similar rankings, which raises the question of why release trajectories are preferable to just looking at the locations themselves. My view is that by keeping the focus specifically on mechanical variables within the pitcher’s control and removing any external environmental factors like wind or weather, the metric better explains command; it also has the added benefit of capturing year-to-year effects with greater accuracy.)
The Kirby Index has a glaring limitation. The baked-in assumption is that pitchers are throwing to a single target, and that each pitch that deviates from that single target is a mistake. This, of course, does not completely align with reality. Zac Gallen, for example, ranks near the bottom of the 2024 Kirby index in part because he’s aiming at eight or nine separate targets within a given start. Kirby is perhaps aiming for slightly fewer locations, but hitting them all with remarkable frequency. The single-target assumption of the Kirby Index means that it is not coming particularly close to harnessing the full power of the relationship of release angles to command — but as you’ll see, it still captures something significant.
Here is a plot of Kirby’s release angle clusters so far this season compared to one of the Kirby Index laggards: Patrick Sandoval.
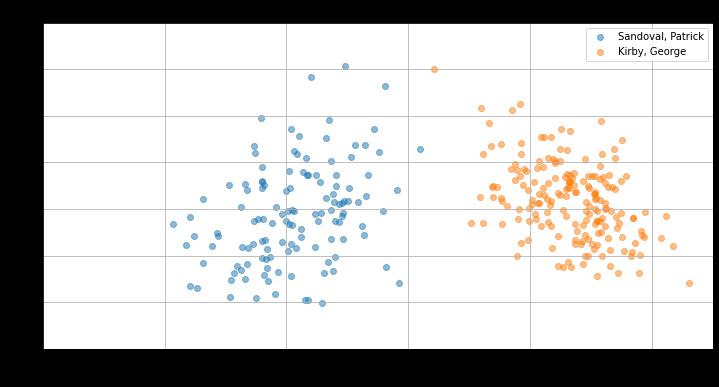
Notice the spread of Sandoval’s release angle pairs compared to the density of Kirby’s. There is clearly something here about the repeatability of release angles that points to command ability, at least on the extremes. Which brings us to the second question: How can we measure how “good” the Kirby Index is at predicting command?
One potential answer would be walk rate. Walk rate, or BB%, is often associated with command, but as Eno Sarris wrote in 2018, it might be better to say that walks are more closely related to control, or the ability to avoid balls. Command requires use of not just the strike zone but the locations on its immediate edges. A’s reliever Ryan Buchter told Eno that he misses the strike zone on purpose, and is willing to walk a batter in order to move onto a more favorable matchup.
“I’m just not giving in to hitters,” Buchter told Eno. “Even if it’s a lefty up and a righty on deck, and I fall behind, I don’t give in. That’s my game.”
So walk rate is perhaps not the best proxy for command. A better answer might be something like weighted runs, a stat that tries to count up every event that occurs when the pitch is thrown and defines the results based on the runs saved (or lost) on the specific pitch.
Here, the Kirby Index matches up surprisingly well over small samples compared to Location+ FA and botCMD FA in predicting fastball run values — though it is important to clarify here that these two models and the Kirby Index are doing slightly different things. Location+ FA and botCMD FA are grading the location of the pitch; the Kirby Index is making no judgments about the actual location, only assessing whether release angles are being replicated. In that sense, comparing those two models to the Kirby Index is like comparing apples to oranges. But perhaps that makes its performance against these models even more interesting: While Location+ FA and botCMD FA have a somewhat stronger relationship than the Kirby Index to the Statcast version of wFA/C, or weighted fastball runs per 100 pitches, the Kirby Index holds strong when measured up against the PitchInfo version, even surpassing Location+ to this point in the 2024 season:
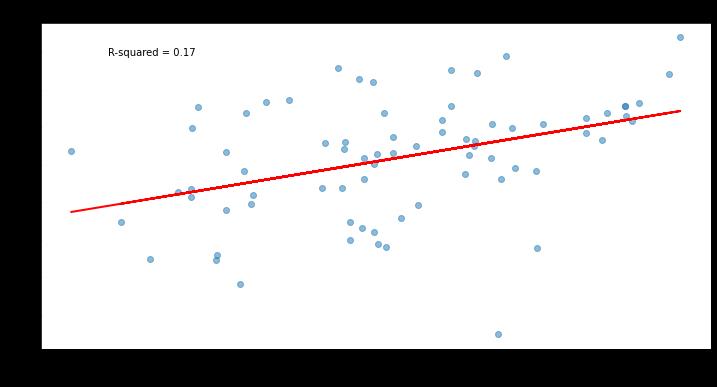
None of these metrics do an amazing job of explaining the variation in weighted runs. I looked at four separate month-long samples, and the highest performer reached an R-squared of 0.14 between the model and the run value of a pitcher’s fastball. As we already know, modeling command is difficult, and our existing strategies are missing key information about intent.
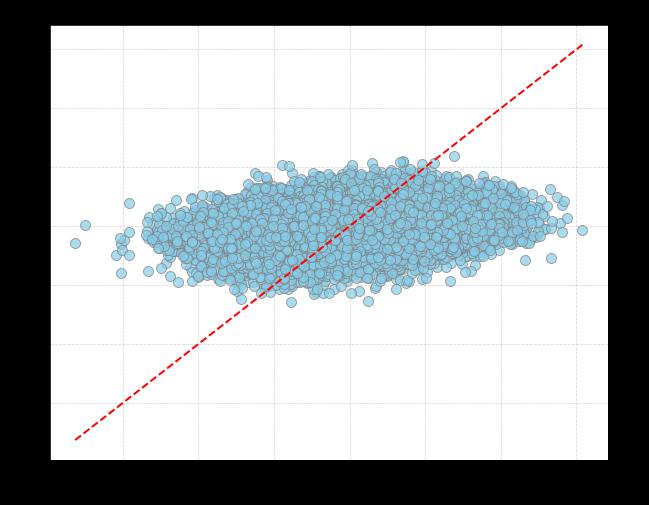
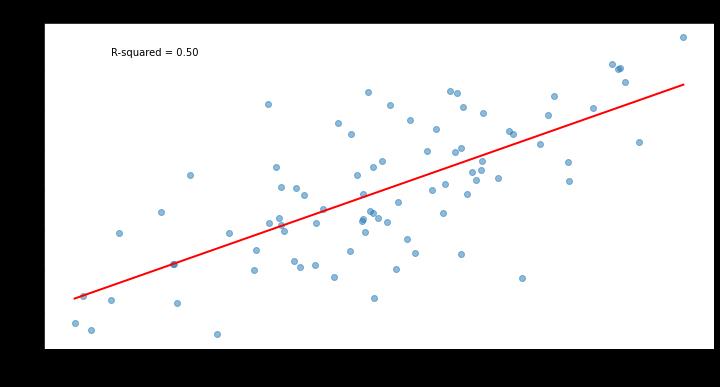
But this is where the Kirby Index could potentially point toward a way forward. One hint is in the way the Index stands out against its competitors in its year-to-year stability. Intuitively, this makes sense: Because it is based on data that is sourced from physical attributes, it ought to better predict itself from year to year than a stat derived from pitch outcomes. This appears to be true in both recent full season samples and slivers of new seasons; in both these samples, the Kirby Index has been “stickier” than its model competitors. Below is a plot of Kirby Index stickiness from the 2022 season to the 2023 season for all pitchers with at least 500 fastballs thrown in both seasons. The R-squared of 0.5 of between-year stickiness surpasses Location+’s R-squared of 0.39:
It also appears stickier in small samples. Here’s how it compares to both PitchingBot and Location+ in stickiness between the 2023 season and the early part of 2024:
That leads to our final question: How quickly does the Kirby Index become reliable within a given season? To test this, I looked at the start-to-start stability of vertical release angle standard deviations, the key input of the Kirby Index. I calculated the maximum and minimum VRA standard deviation for all appearances where the pitcher threw at least 25 four-seam fastballs, and looked at all pitchers with at least 10 appearances that met this threshold.
For single starts, the median difference between standard deviations was 0.39, meaning that the “true” full season VRA value was 0.2 standard deviations away from the most extreme start. For two-start rolling averages, that difference dropped to 0.26, meaning a gap of about 0.1 standard deviations between the true value and the most extreme two-start window. In other words, it generally takes somewhere between one or two starts to get a strong sense of where a pitcher’s “true” VRA — and therefore their true Kirby Index — really stands.
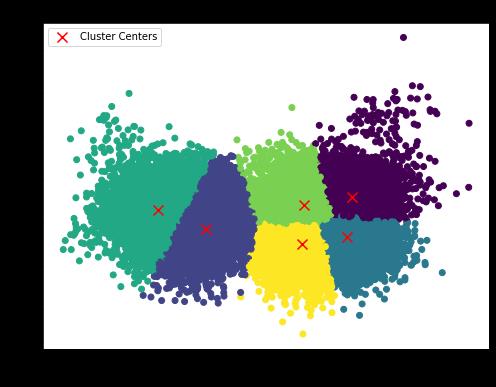
In theory, the Kirby Index could become even more powerful. Major league pitchers, after all, don’t just throw to one location; the best try to aim at eight, nine, perhaps even 10 distinct targets. Can we build a Kirby Index that accounts for this reality?
Using K-Means, we can try — but at present, the weighted standard deviation percentiles outperform more sophisticated approaches. I tested two, three, and six clusters; I split the data by handedness; I looked at only vertical locations — and across these combinations, the simple Kirby Index performs best. Theoretically, there should be a way to incorporate K-Means and a little bit of trigonometry to measure how well pitchers hit these specific release trajectory combinations and therefore improve the strength of this model, but that is a subject for a future post (or another researcher!). That process would likely start by first identifying “ideal” locations as defined by global trajectory clusters, and then seeing how frequently a pitcher comes close to these ideal targets. Unfortunately, that would require normalizing release angles by release height and arm angle of the delivery, and I’ve already done way too much math in this article.
For now, it is enough to say that the Kirby Index points at something real — with the promise of even more.
…
The next frontier of data analysis in baseball is biomechanics. Statcast measures outputs; biomechanics are the inputs that produce the xwOBAcon and Stuff+ figures that we currently think of as “process” stats. For good privacy-related reasons, that information is largely limited to the direct knowledge of the teams that pay players’ salaries, but it doesn’t take much imagination to see how that information could be enormously valuable in predicting where the next George Kirby might come from.
Somewhat incredibly, this biomechanical proxy can be calculated — or at least estimated — using a handful of Statcast inputs and borrowing from physics and geometry. We could say then that release angles are at both the literal and metaphorical threshold of the shifting movement from process-related statistics, freely provided in a Statcast .csv, toward biomechanical variables, largely the purview of the teams. After all, release angles themselves are only an output of a series of biomechanical inputs, a product of pelvises, elbows, wrists, shoulders and fingers, all coming into concert to produce a particular trajectory of a thrown ball.
This study is only a limited attempt to capture the potential power that release angles might offer to command modelers. It’s not really even a model, just a weighted set of standard deviation percentiles. And it is constructed simply: In this iteration, K-Means clustering is left on the cutting room floor, leaving garden-variety standard deviations for measuring differences in release trajectories. Finally, the study only looks at four-seam fastballs, which are becoming less important in the modern game; future studies will undoubtedly look into offspeed pitches, differentiate by handedness, and better identify ideal targets.
For now, the Kirby Index is a useful shorthand for understanding, if not necessarily predicting, command over small samples. As one high-profile Stuff modeler wrote on Twitter, “A location metric for a single game won’t tell us much.” The Kirby Index suggests that perhaps it can.
…
The 2024 Kirby Index
Minimum 125 four-seam fastballs in 2024 season. All data as of May 2.
Unless noted, all stats are through April 19.
Source
https://blogs.fangraphs.com/introducing-the-kirby-index-a-new-way-to-quantify-command/
