Darren Yamashita-USA TODAY Sports
I think everyone has moments where they wonder just what the hell they’ve done with their lives. I’ve been blessed with the divine spark of human consciousness, and a body to tote those thoughts around in, and what have I accomplished? I had one of those moments recently while I was holding a friend’s baby, trying to make her laugh. What a delightful and important but most of all profound thing, to create a whole other person and cultivate her — from scratch — into a happy adult.
Or the next best thing, creating art. I’ll speak to what I know: music. I’m left in awe of songs that, through dynamic contrast and precision of rhythm and density of countermelody, seem to be carrying that divine spark themselves — the second movement of Beethoven’s 7th symphony, or Typhoon’s “Prosthetic Love.” So much care and emotion went into such composition that it’s hard not to be bowled over by the emotional transference of the artistic process even as you’re astounded by how precisely the pieces have been crafted and how seamlessly they fit together.
Again: What am I doing with my life to show that I value this gift? How am I using this spark to shape the world into a better place? How am I passing this light on to others? This thought burst out and grabbed me recently when I was poking around our site’s pitcher defense leaderboards and noticed something interesting about Josh Fleming.
See, Fleming is tied for the league lead on the pitcher DRS leaderboard, despite having thrown only 19 innings this season. He’s done a lot. In just 19 innings he’s made two putouts and seven assists, and participated in three double plays. Here’s one of them, beginning with a 101.9 mph comebacker off the bat of Nico Hoerner.
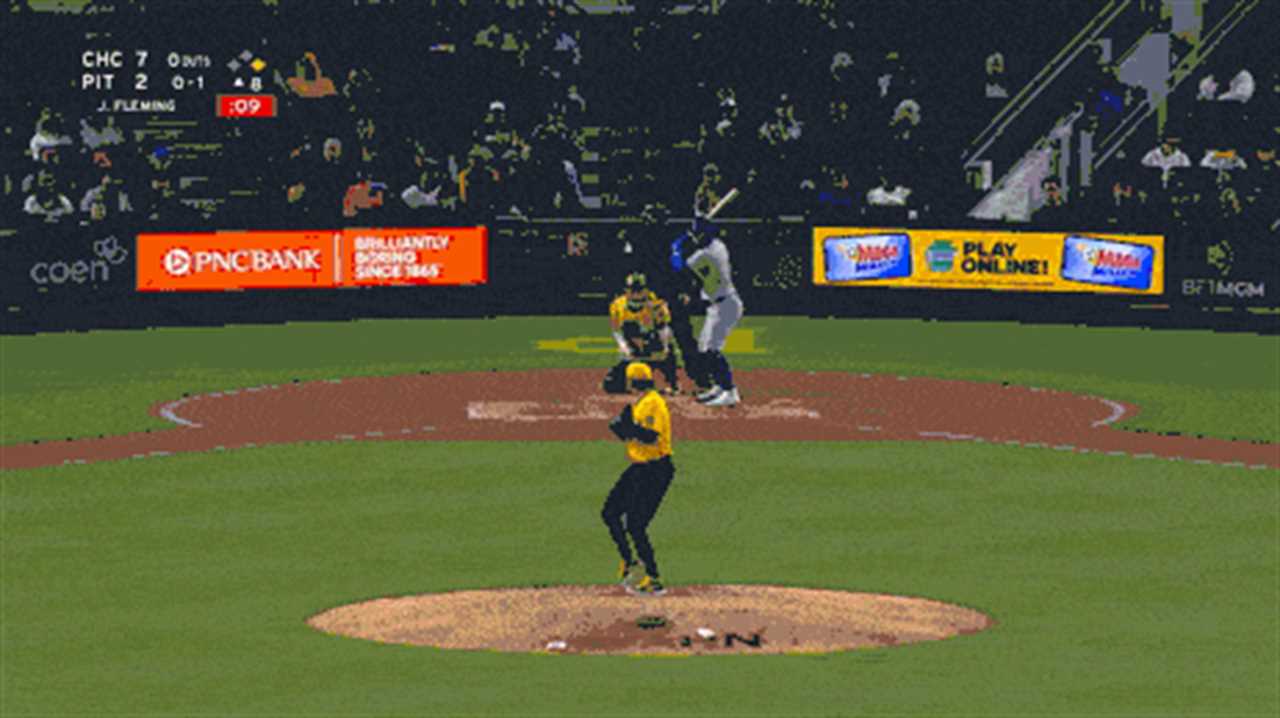
Look how smooth and assured Fleming is as he fields his position. Not a care in the world. And he looks great in those yellow City Connect jerseys.
Why should you care about this? You shouldn’t! You know who doesn’t care? The Pirates, who DFA’d him two weeks ago and outrighted him to the minors after the other 29 teams — who clearly don’t care about his defense either — passed on the opportunity to claim him on waivers.
Fleming’s defensive capabilities, no matter what they may be, are of secondary importance to his ability to pitch. Fleming’s career ERA was 4.94 when he got DFA’d. Sure, we keep track of pitcher defensive stats, but it doesn’t go into WAR or get posted on Baseball Savant. Every baseball fan can name a few pitchers who are regarded as great defenders — Greg Maddux, Zack Greinke, Jim Kaat — but that’s mostly as a piece of trivia for pitchers who were really good at their day jobs.
You know what they call bad pitchers who defend their position well? Outfielders.
And this is as it should be. Pitchers are specialists who don’t even hit anymore; they only barely play defense. Corbin Burnes led all pitchers last year with 29 putouts; no other pitcher had more than 24. Nathaniel Lowe led all of baseball in putouts with 1,221. Patrick Corbin led all pitchers with 36 assists in 2023; Andrés Giménez led all position players with 401.
It’s a tiny part of the job, and so much of it is based on discretion. Most infielders will call off a pitcher for a popup when they have the chance, and whether a pitcher gets a putout on a grounder to the first baseman is largely a measure of the first baseman’s preference. Even the most spectacular defensive plays pitchers make — snagging line drives through the box — are a matter of reflex and survival instinct. There’s no amount of training that separates a SportsCenter highlight from getting Charlie Browned.
But Fleming had pretty impressive per-inning defensive numbers in previous seasons, and I didn’t have anything better to do with my life, so I dug a little deeper.
There are 210 active pitchers with at least 200 career innings pitched. Unfortunately, because our “Active” filter requires a player to be on an active MLB roster at the time of the search, Fleming didn’t make the cut. So I added in all his numbers manually to bring the total sample to 211. For his career, Fleming has a fielding percentage of .984, which is pretty good — tied for 26th among active pitchers — but not spectacular; 15 active pitchers have gone their entire careers without making an error.
Nor does it account for Fleming’s six double plays in just 242 1/3 career innings; of the 25 pitchers with better fielding percentages, only Logan Webb had turned more double plays (nine). And only three pitchers with better fielding percentages had even turned six double plays. Webb and the others — Ranger Suárez, Rafael Montero, and Michael Soroka — have all thrown more career innings. Webb and Suárez have thrown more than twice as many innings as Fleming, in fact.
There must be a way to reward pitchers who make more plays.
Now, it’s worth posing the question of whether a pitcher who makes more plays is actually a better defender. The plays that only a pitcher can make — mostly on bunts and covering first base — are relatively few. On balls hit up the middle, the best thing a pitcher can do is usually to get out of the way and avoid making the middle infielders’ jobs harder. Sit down, sir, and let the pros handle this.
2024 Leaguewide Fielding Percentage by Position
| Position |
Fielding Percentage |
| Pitcher |
.956 |
| Second Base |
.986 |
| Shortstop |
.971 |
But not wanting to encourage a generation of idle goldbricking pitchers, I decided to view defensive involvements as a positive, and rank pitchers on a per-inning basis. Here are the leaders in chances (putouts plus assists plus errors) per inning pitched. This list, like Nigel Tufnel’s amp, goes to 11, because Fleming ranks 11th among active pitchers in this metric.
Active Career Leaders in Chances Per Inning Pitched
And for a moment, I was pleased with my creation, until I started to wonder whether I’d been wildly underrating Tyler Rogers’ defensive capabilities for his entire career. Quite quickly, I realized that this was not so much a list of great defensive pitchers as a list of pitchers who didn’t strike out very many batters. No matter, let’s just rank defensive chances as a function of innings pitched through balls in play — strikeouts divided by three, subtracted from the number of total innings pitched.
Active Career Leaders in Chances Per In-Play Inning
| Name |
Chances |
In-Play IP |
Chances/Adj. IP |
| Joe Musgrove |
276 |
674 2/3 |
.409 |
| Clay Holmes |
78 |
191 1/3 |
.408 |
| Wandy Peralta |
108 |
265 2/3 |
.407 |
| Tyler Rogers |
91 |
227 |
.401 |
| Ranger Suárez |
141 |
364 |
.387 |
| Jordan Hicks |
77 |
200 1/3 |
.384 |
| Brent Suter |
133 |
354 |
.376 |
| Scott Alexander |
77 |
205 1/3 |
.375 |
| Raisel Iglesias |
139 |
371 1/3 |
.374 |
| Max Fried |
192 |
520 1/3 |
.369 |
OK, this is more like it. Suárez is viewed as an elite defender, though he’s never thrown enough innings to qualify for a Gold Glove. Speaking of Gold Gloves, though, Fried’s won three of them. If he’s in the top 10, I’m on the right path. As for Musgrove, well, he’s 6-foot-5 with shoulders like a cantilevered bridge; maybe he’s just so wide he’s able to suck up all the grounders… and then it hit me. Holmes, Rogers, Alexander — these are predominantly groundball pitchers. Time to winnow the denominator one more step.
I calculated what percentage of each pitcher’s batted balls were theoretically fieldable by the pitcher himself — line drives, groundballs, and infield popups — and reduced each pitcher’s adjusted innings total appropriately. This is the result.
Active Career Leaders in Chances Per Fieldable Inning
| Name |
Fieldable Ball% |
Chances/Fieldable IP |
| Joe Musgrove |
68.8% |
.595 |
| Raisel Iglesias |
66.3% |
.565 |
| Wandy Peralta |
74.0% |
.549 |
| Brent Suter |
69.9% |
.537 |
| Tyler Rogers |
76.6% |
.524 |
| Ranger Suárez |
74.3% |
.521 |
| Corbin Burnes |
71.0% |
.511 |
| Griffin Canning |
61.1% |
.500 |
| Andrew Chafin |
72.5% |
.495 |
| Jordan Hicks |
79.0% |
.487 |
What we have here is an approximation of range factor for pitchers. It answers the question of how many plays a pitcher makes as a proportion of total field outs recorded while he’s on the mound, but it leaves two other issues unsolved. The first is how to deal with bulk versus efficiency. Musgrove is making more plays than anyone else, but among pitchers in the top 10 in range, Peralta and Suárez have more than 20 points of fielding percentage on the Padres righty. The second is how range interacts with fielding percentage.
If one were to create a holistic pitcher defense metric, one would have to balance Musgrove making one more out than Suárez every 15 fieldable balls in play versus Suárez making nearly three times as many outs per error as Musgrove. Which matters more?
So in the interest of knowing the limits of my own mathematical prowess, as well as — to go back to the original point — nobody cares very much about pitcher defense, including major league teams, I decided not to bother.
Instead, I chose to plot two stats: First, this range estimation. Second, an efficiency metric: outs recorded over defensive chances. This is basically fielding percentage, except when a pitcher participates in a double play he gets credit for an extra out. This is probably not how I’d weigh outs versus double plays versus errors in an ideal world, but it’ll do for now.
And rather than graph these raw numbers against each other, I determined how many standard deviations each pitcher was above or below the mean in each stat, then graphed those numbers against each other.
If you glazed over sometime between “Josh Fleming” and that little methodology section, what you need to know is this: Dots above the x-axis represent pitchers who commit fewer errors per out recorded. Dots to the right of the y-axis represent pitchers who make lots of defensive plays, irrespective of error rate. The best defensive pitchers will go in the top-right quadrant.
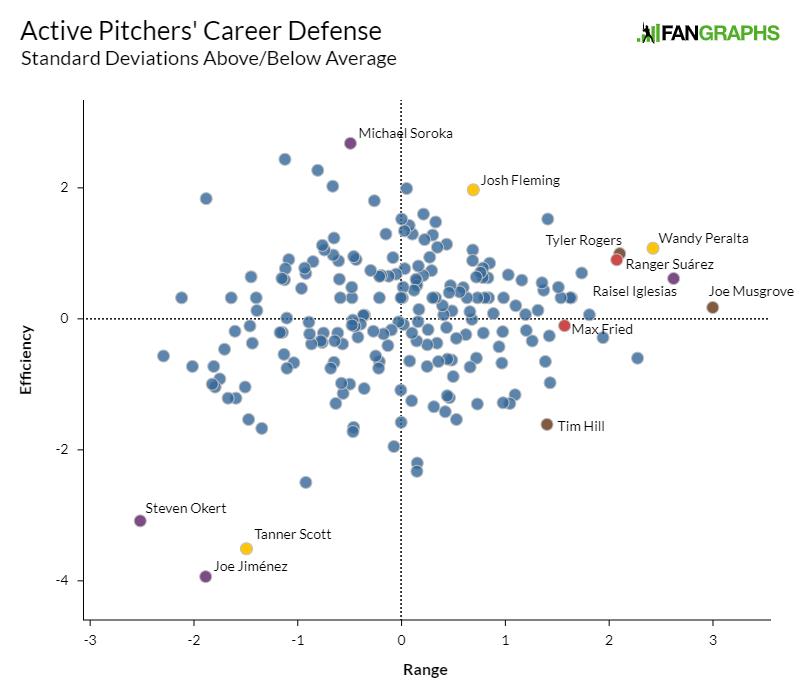
Sure enough, that’s where all the names we’ve been seeing throughout this article are going — Suárez, Rogers, Peralta, Musgrove (though only just). And sure enough, Fleming, who ended up as something of an outlier. The surest-handed pitcher in the league, Michael Soroka, actually makes fewer defensive plays than average, proving that discretion is the better part of pitcher defense. Conversely, Tim Hill gets to lots of batted balls, but also makes lots of errors.
I’ve also pointed out a trio of negative outliers: Tanner Scott, Steven Okert, and Joe Jiménez, though doing so seems a little mean-spirited. Don’t worry, fellas, this doesn’t matter anyway.
Most of all, I’m delighted to see what I think we can all agree is the vindication of my original thesis: Josh Fleming is a good defensive pitcher. I can only hope finding that out was worth expending a bit of my divine spark.
Source
https://blogs.fangraphs.com/is-josh-fleming-a-lost-gold-glover/
