John Jones-USA TODAY Sports
In the modern game, pinch-hitting is seen as something of a lost art. This likely started with teams prioritizing roster spots for extra bullpen arms over spare position players. With that came a heavier emphasis on positional flexibility off the bench, rather than plus contact skills (think Ross Gload) or a big bopping bat (à la Matt Stairs). As an angry Facebook commenter might tell you, it’s one more way that sabermetrics has ruined America’s pastime. Yet, the numbers bear it out; the best arm is often a fresh arm, while conversely, fresh bats off the bench tend to perform significantly worse than their counterparts in the starting lineup. Ahead of the 2020 season, Ben Clemens found that the pinch-hitting penalty, first theorized in 2006, still held 14 years later. Contemplating Ben’s findings, Patrick Dubuque of Baseball Prospectus penned a line that stuck deep in my brain: “Pinch-hitters are just difficult to justify, except when they’re mandatory.”
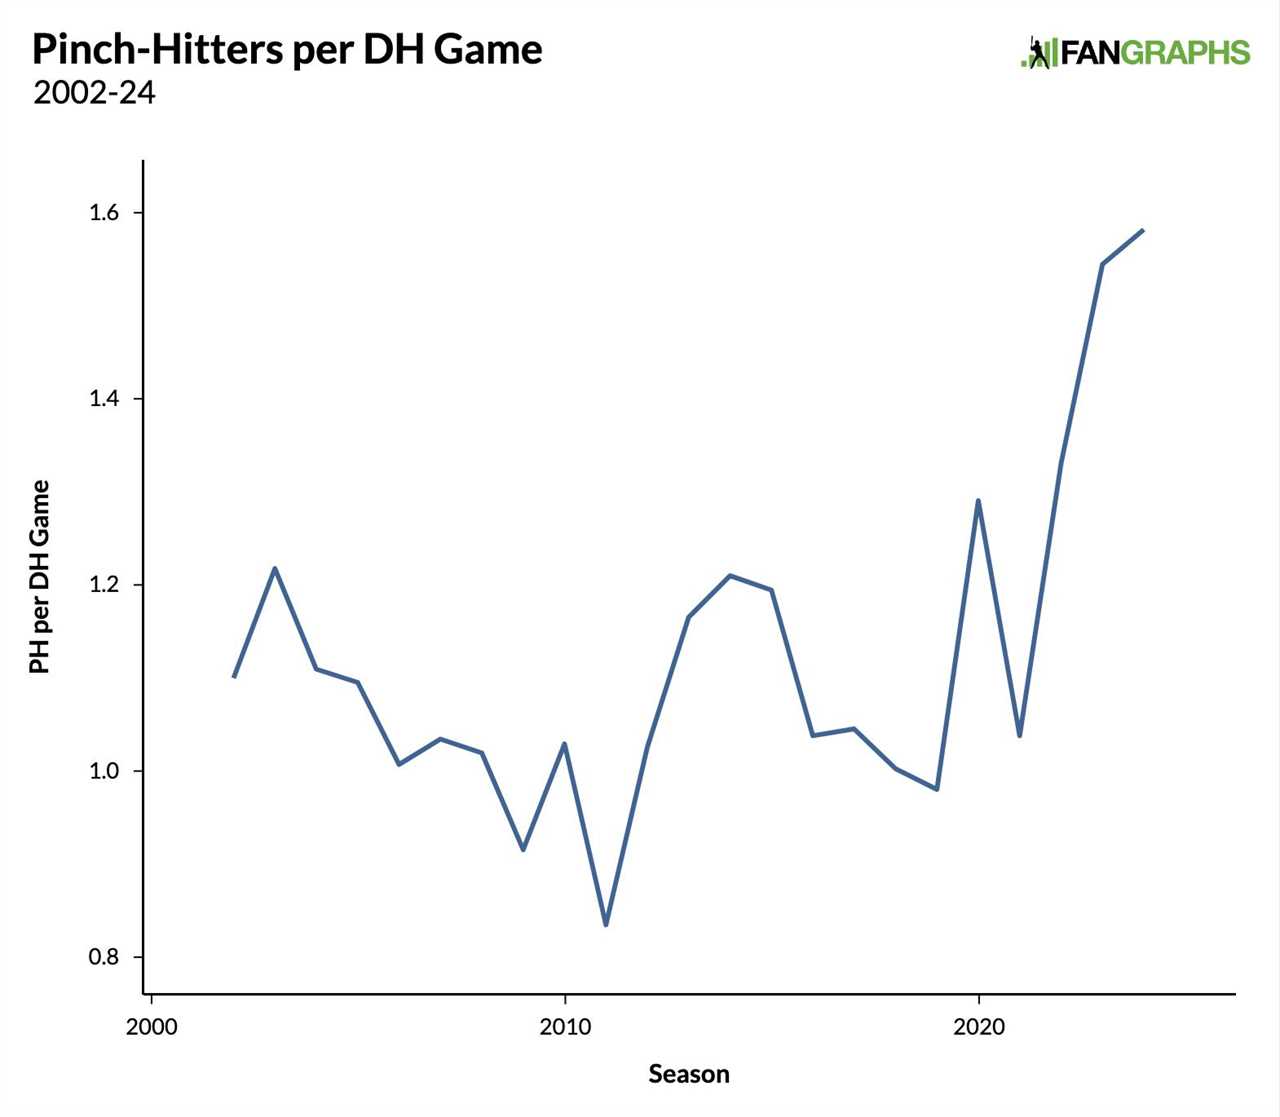
Pinch-hitters were mandatory far less often in 2020 after the universal DH came into play. However, the age of the universal DH is also the age of expanded rosters and pitcher limits, and those new roster rules may just have saved the pinch-hitter from a slow demise. Pinch-hitters are rarely mandatory anymore, but they haven’t disappeared as much as you might think.
In 2020, the number of pinch-hitters deployed per game dropped dramatically. Of course it did; NL teams no longer had an automatic out at the bottom of their starting lineups. And yet, the short season and overall decline in pinch-hitting obscured a fascinating trend: Pinch-hitting plate appearances per game played under the designated hitter rule were way up. Teams used more pinch-hitters per “DH game” (get used to that shorthand) than they did in any year since at least 2002, which is as far back as the data on our splits tool goes:
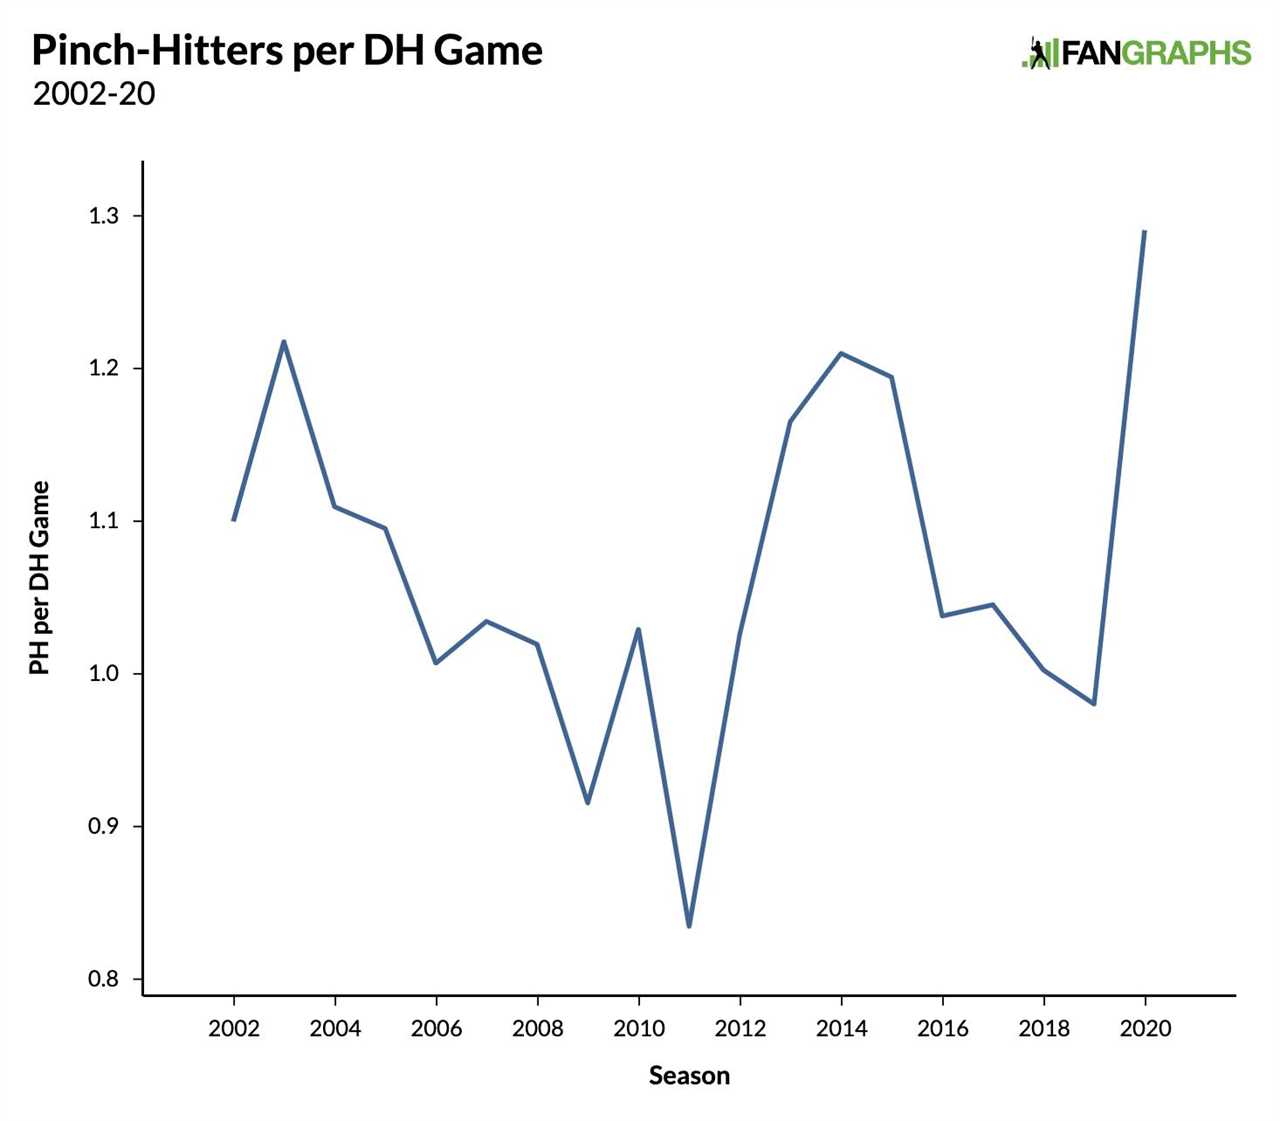
Not only was the rate of pinch-hitters per DH game higher in 2020 than any of the past 18 years, but the difference between 2019 and 2020 marked the largest year-over-year change up to that point. There is little doubt that expanded rosters facilitated this trend; teams were allowed 30-man active rosters for the first two weeks of play and 28-man rosters for the rest of the season. The new extra-inning rule also provided more incentive for pinch-hitting late in games. However, the increase in pinch-hitting was more than just a natural consequence of the new rules. It was a conscious, strategic decision on the part of certain managers.
How can I say that with such certainty? For one thing, although the rate of pinch-hitters per DH game was way up in extra innings, there were far fewer extra-inning plate appearances overall, precisely because of the new rules. Thus, extra-inning pinch-hitting appearances actually accounted for a lower percentage of all pinch-hitting appearances than they did the year before. More importantly, the additional pinch-hitting appearances in 2020 were not evenly distributed throughout the league; NL teams were driving the increase. Pinch-hitting was up in both leagues, but AL teams used pinch-hitters for 1.52% of plate appearances while NL teams used pinch-hitters for 1.97% of plate appearances. That’s not too surprising – NL front offices didn’t build their rosters with the DH in mind – but it is still strong evidence that teams were pinch-hitting more often as a matter of strategy.
That said, it would have been easy to write this all off as a fluke amid a wholly irregular 2020 season. Except the same thing happened two years later. In 2022, the next season played with the universal DH and the first played under the 13-pitcher limit, the pinch-hitting rate returned to the peak it reached in 2020. In fact, it was slightly higher:
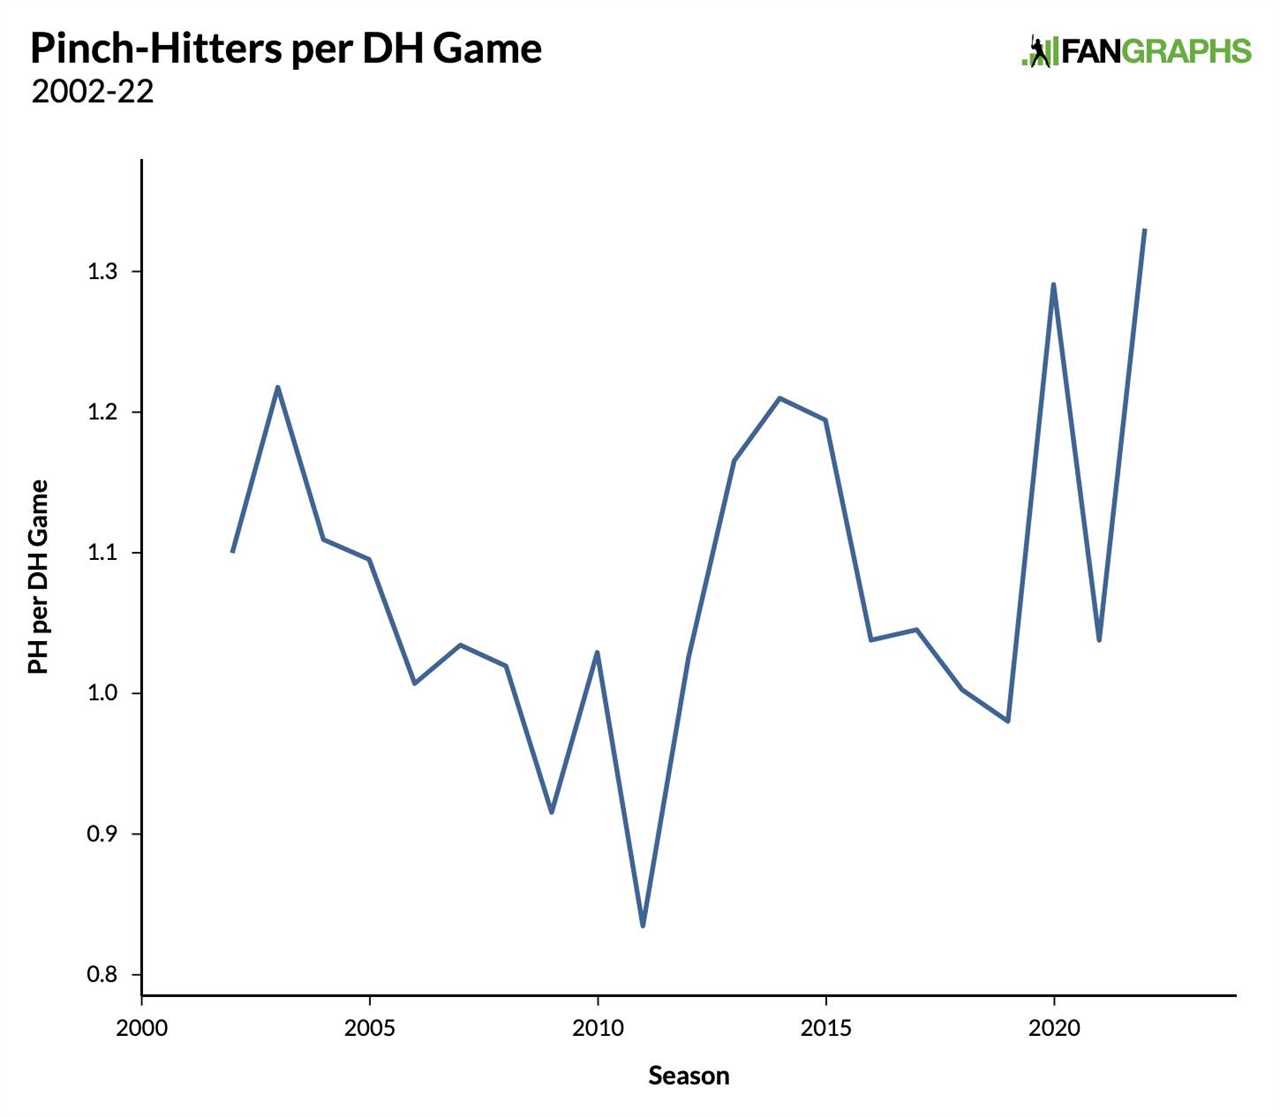
Notably, the difference between the two leagues was much smaller in 2022. NL teams, with more time to prepare for the new rules, no longer used quite as many pinch-hitters, but AL teams increased their pinch-hitter usage to make up the difference.
The following year, both leagues upped their pinch-hitter usage again:
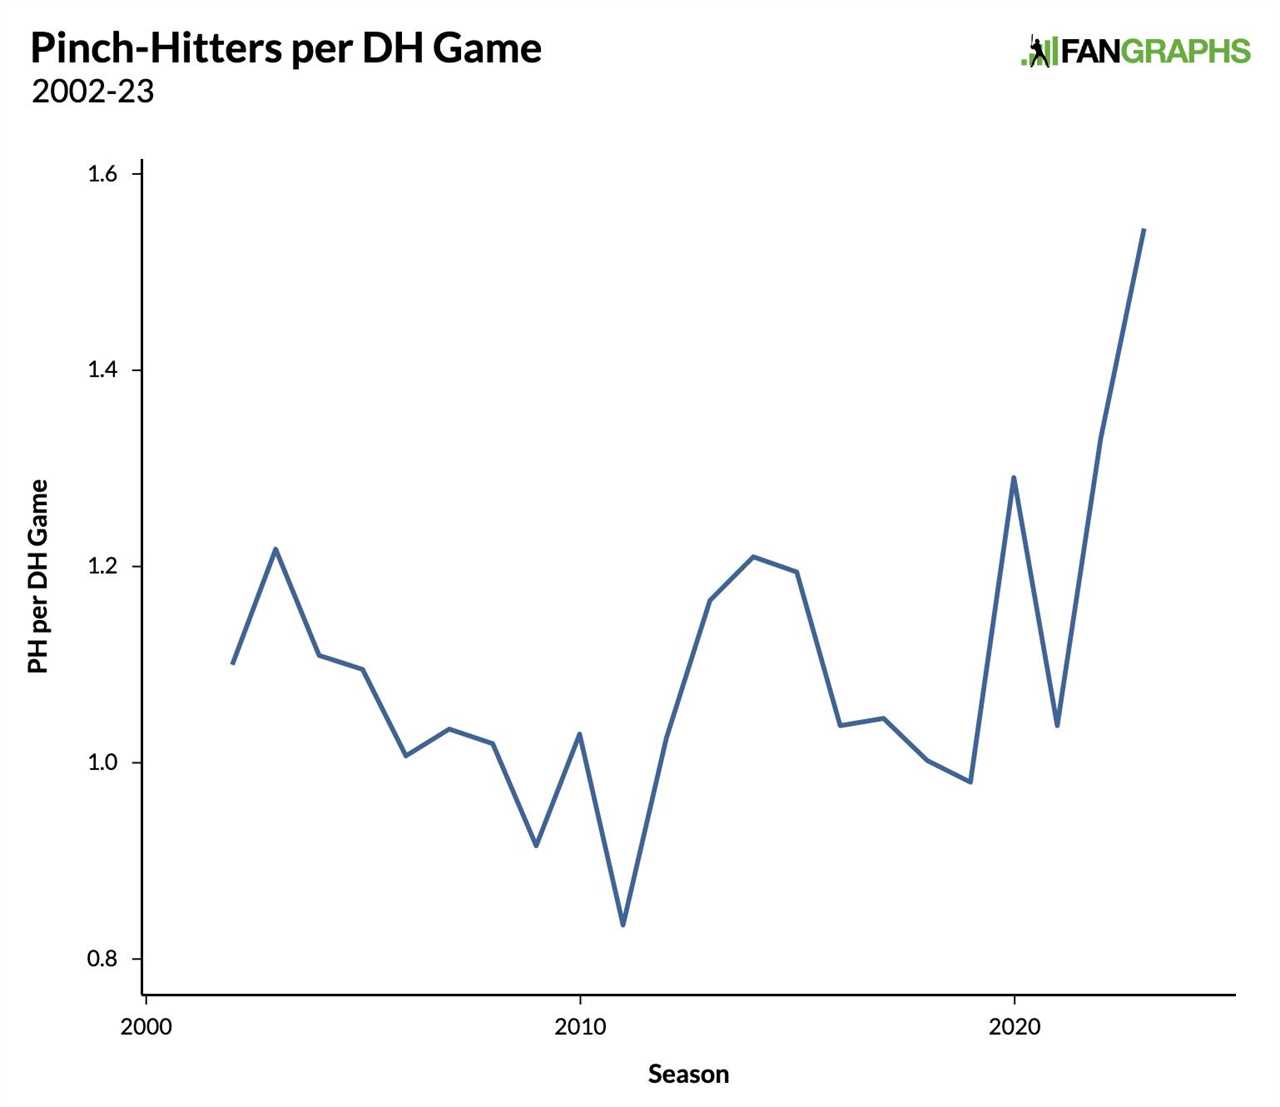
Pinch-hitting was on the rise in 2023, even compared to just the latter portion of the 2022 season, when the 13-pitcher limit was in place. From June 20, 2022 through the end of the regular season, pinch-hitters accounted for 1.87% of all plate appearances. In 2023, pinch-hitters accounted for 2.04% of all plate appearances. Over the course of a full season, that adds up to hundreds of additional pinch-hitting opportunities.
By 2023, the difference in the pinch-hitting rate between the AL and NL was negligible. What’s more, you couldn’t accuse one team of skewing the numbers. While the 2022 Giants used 95 more pinch-hitters than any other club, the 2023 Giants used only 14 more pinch-hitters than anyone else. Only two teams topped 150 pinch-hitter plate appearances in 2022, but seven did so in 2023. Meanwhile, teams at the other end of the spectrum joined in on the fun. The team with the lowest pinch-hitting rate sent just 36 pinch-hitters to the plate in 2022. The following year, that number rose to 70.
Here’s another fun way to visualize the pinch-hitting boom in the era of the universal DH. First, take a look at the leaderboard for most pinch-hitters used by a team in a single season, only in games played with the DH, from 2002-21:
Most PH in a Season (DH Games Only, 2002-21)
| Team |
# of Pinch-Hitters |
| 2015 Rays |
189 |
| 2014 Blue Jays |
180 |
| 2014 Athletics |
168 |
| 2013 Rays |
166 |
| 2016 Mariners |
152 |
| 2010 Rays |
151 |
| 2014 Rays |
147 |
| 2003 Devil Rays |
145 |
| 2012 Rays |
142 |
| 2013 Athletics |
141 |
Now, take a look at that same leaderboard with 2022 and ’23 added into the mix:
Most PH in a Season (DH Games Only, 2002-23)
| Team |
# of Pinch-Hitters |
| 2022 Giants |
258 |
| 2023 Giants |
217 |
| 2023 Athletics |
203 |
| 2015 Rays |
189 |
| 2023 Twins |
186 |
| 2014 Blue Jays |
180 |
| 2023 Dodgers |
177 |
| 2023 Tigers |
174 |
| 2014 Athletics |
168 |
| 2013 Rays |
166 |
Teams from the 2023 season occupy half of the top 10 spots. That holds true even if you prorate the numbers to account for the fact that AL teams from 2002-19 and 2021 played a handful of interleague games at NL ballparks without access to the DH. To be fair, there are now twice as many teams with access to the designated hitter, yet still, only 30 teams played with a DH in 2023, while 334 teams played with a DH from 2002-22.
Now, let’s talk about 2024. After all, there has to be a good reason I’m writing about this today. As of May 5, pinch-hitting rates are on the rise again:
The year-over-year increase is small, but it’s more significant if we remove September/October from last year’s sample; pinch-hitting rates almost always rise in September as rosters expand. From March to August of 2023, pinch-hitters took 2.00% of plate appearances. So far in 2024, pinch-hitters have taken 2.10% of all plate appearances. To put it another way, the league is currently on pace to use 3,847 pinch-hitters in 2024; last year, the league used 3,753 pinch-hitters. That’s a difference of 94, and this year’s pace doesn’t factor in the bump that’s likely to come over the final month of the season.
When it comes to individual teams, four are currently on pace to break onto the top 10 of that prorated leaderboard I mentioned earlier:
Most PH in a Season (DH Games Only, 2002-24)
| Team |
# of Pinch-Hitting PA (DH Games) |
| 2022 Giants |
258 |
| 2024 Tigers |
224 |
| 2024 Twins |
221 |
| 2023 Giants |
217 |
| 2023 Athletics |
203 |
| 2015 Rays |
201 |
| 2024 Athletics |
199 |
| 2014 Blue Jays |
192 |
| 2024 Brewers |
187 |
| 2023 Twins |
186 |
Prorated to 162 games
As for individual players, five different batters made at least nine pinch-hitting appearances during the first month of the 2024 season: Eguy Rosario, Wilmer Flores, Manuel Margot, Joc Pederson, and Oliver Dunn. Only nine individual players reached that threshold during any single month last year, and five of them only did so in September/October. The first “month” of the season was a little longer in 2024 (55 games took place in March), but that’s still noteworthy. Moreover, as of Sunday, two more players have reached the nine pinch-hit plate appearance threshold: Austin Slater and Jesús Sánchez. Four have already reached double-digits: Rosario, Margot, Flores, and Slater, who has pinch-hit twice so far in May. The same number of games into the 2023 season (1036), only three players had nine pinch-hit plate appearances: Trayce Thompson, Raimel Tapia, and Zach McKinstry.
There is plenty of time left for these trends to change, but as things stand, it’s hard to ignore that managers have been choosing to pinch-hit more and more often since the beginning of the universal DH era. Expanded rosters may have opened the door for additional pinch-hitters, but the continued increase in pinch-hitting suggests this is about more than just the availability of an extra bench bat. Teams are pinch-hitting not just because they can, but because they want to.
On the one hand, it makes sense in the age of information (and relief pitchers) that teams are looking for every possible way to gain an edge in late-game matchups. At the same time, managers and front offices know (or at least they have no excuse not to know) that pinch-hitters enter games at an immediate disadvantage. In other words, bringing in a pinch-hitter is only the right call if that pinch-hitter represents more than a marginal upgrade over the batter he is replacing. While it’s clear pinch-hitting is on the rise, the million-dollar question is whether it’s rising in the right situations.
At least some signs say that it is. For one thing, pinch-hitters have had the platoon advantage more often in recent years:
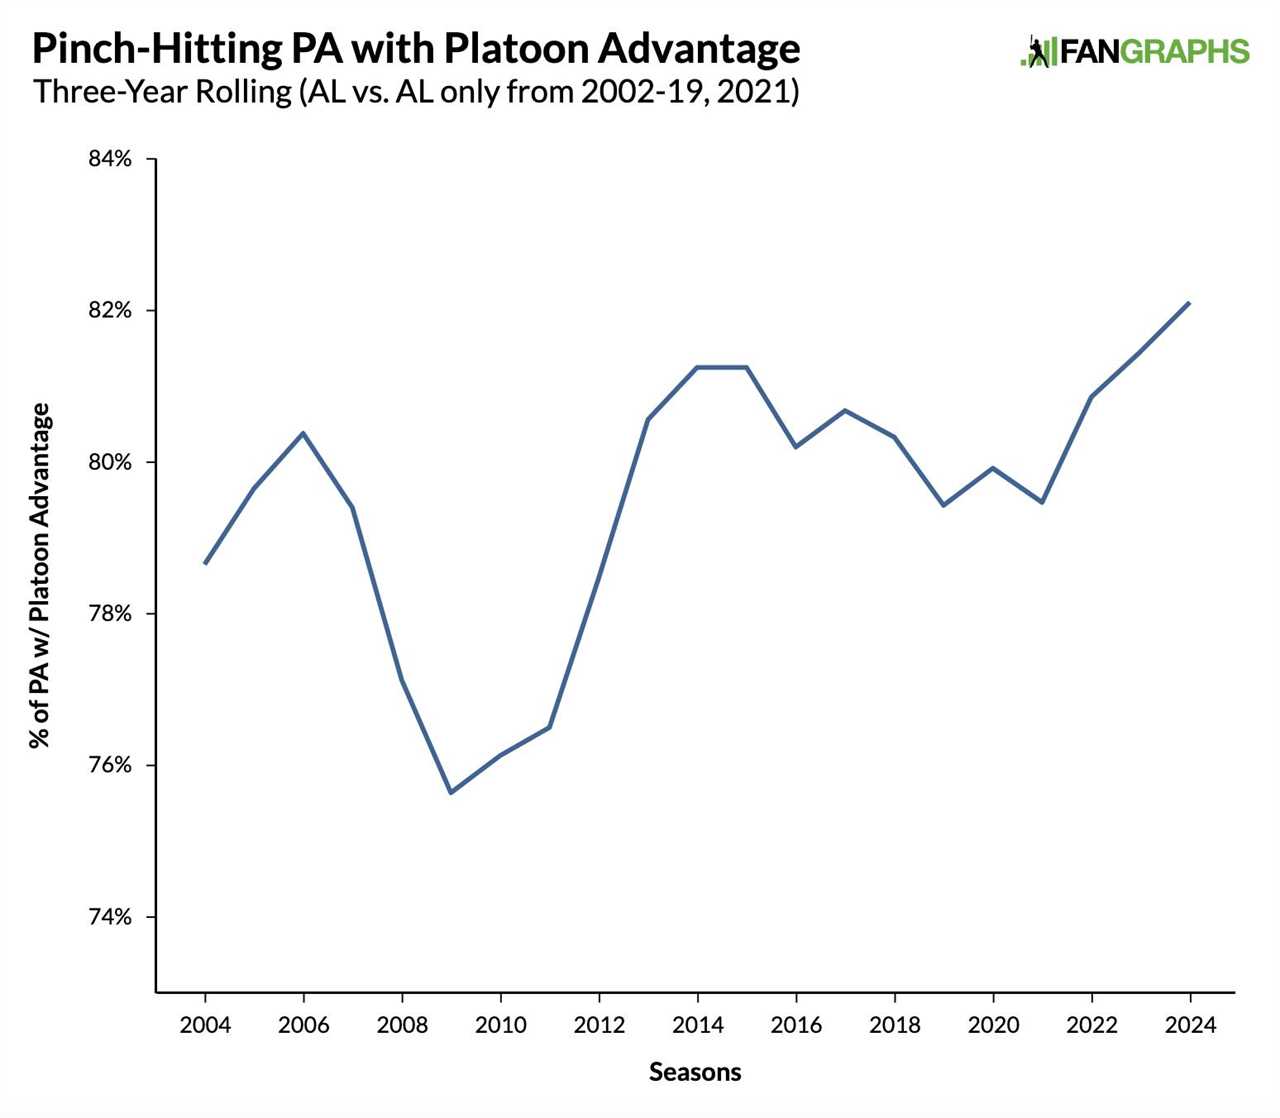
These days, teams have more advanced ways to identify ideal pitcher-hitter matchups than mere handedness. Still, a good chunk of the time, the smartest option against a lefty reliever is going to be the best overall righty bat remaining on the bench.
Indeed, for what it’s worth, pinch-hitter performance is also trending upward:
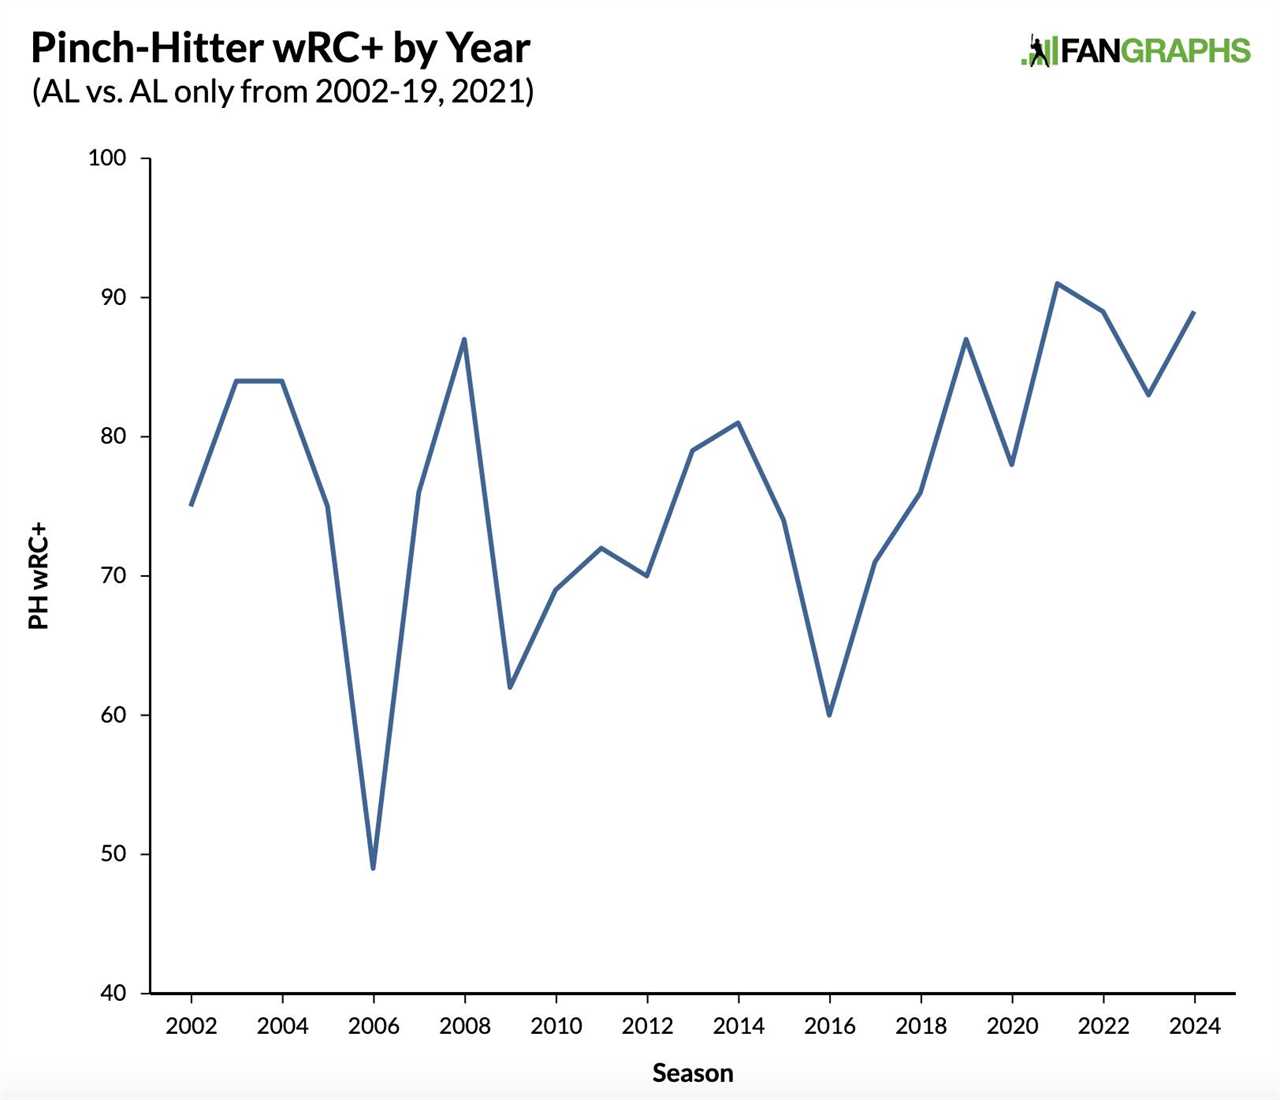
Since 2002, pinch-hitters have an 86 wRC+ in 7,805 plate appearances. AL pinch-hitters never topped an 81 wRC+ in any three-year period between 2002-19. I would take those AL numbers with a grain of salt; there could be a selection bias effect in that better pinch-hitters gravitated toward NL teams before the universal DH. Still, this is a good indication that present-day pinch-hitters are better equipped to succeed.
Unfortunately, the looming question still remains. Even if we could say with confidence that managers are getting better at using pinch-hitters, and pinch-hitters are performing better as a result, we still wouldn’t know if pinch-hitters are better enough to justify the extra plate appearances they have been given. Collectively, pinch-hitters are much worse than the average bat. They probably always have been and probably always will be. Neither AL nor NL pinch-hitters have topped a 94 wRC+ in a single season since at least 2002. Thus, rather than a secret weapon off the bench, a pinch-hitter is meant to be the lesser of two evils. As we watch more and more pinch-hitters come to the plate in 2024 and cobble together a collective .204/.299/.340 slash line, all we can do is wonder if the unseen evil – the batters removed from the lineup – would have performed any worse.
Source
https://blogs.fangraphs.com/pinch-hitting-is-on-the-rise-in-the-age-of-the-universal-dh/
