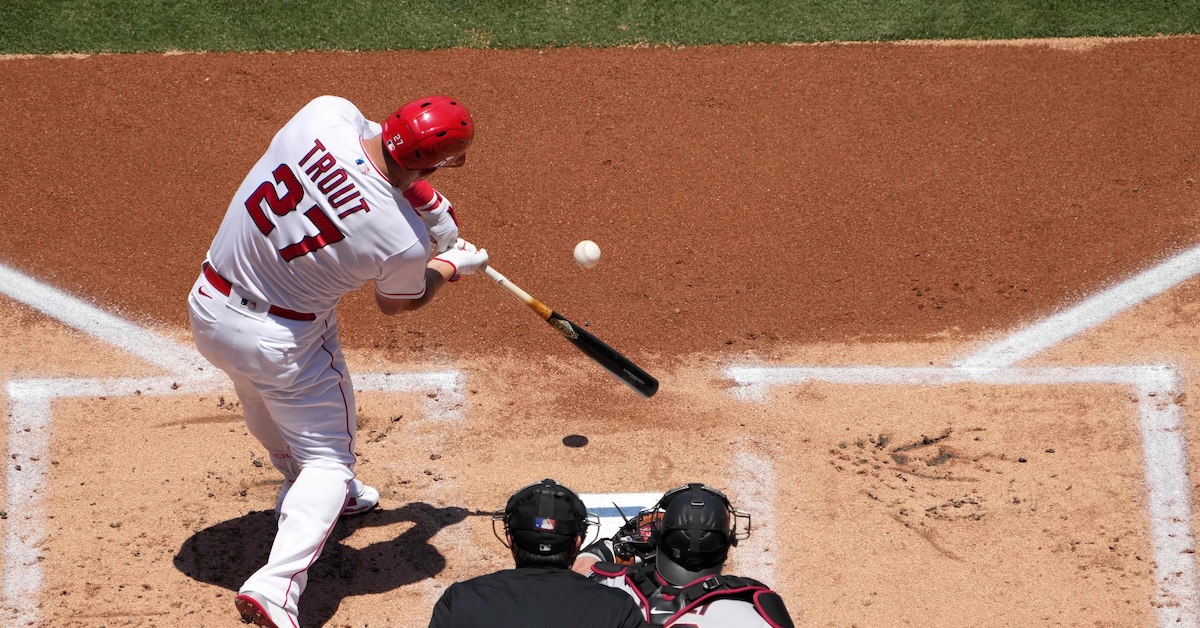
Kirby Lee-USA TODAY Sports
One of the numerous reasons why Mike Trout’s latest injury — a torn meniscus in his left knee, requiring surgery that will sideline him for at least four weeks and perhaps longer — is such a bummer is that the three-time MVP and future Hall of Famer was off to a pretty strong start. While his .220/.325/.541 slash line is nothing to write home about within the context of his career — indeed, his 141 wRC+ would be his second-lowest mark, after last year — he had hit 10 homers before the end of April for just the second time (2018 was the other). That total was enough to share the major league lead with Gunnar Henderson, and it put him on pace to challenge his career high of 45 homers, set in 2019. Even within an offensive profile that’s undergoing some evolution as he ages, that’s impressive.
That goes doubly given that through the end of April, league-wide home run rates were down more than 15% relative to last season. Where in 2023 teams averaged 1.21 home runs per game, through the end of April they had averaged just 1.02 homers per game. Note that we’re still early enough in the season that a single day’s slate of games can bump that last decimal in one direction or another; with 20 homers in 30 team-games on May 1, the season-to-date average fell from 1.018 homers per game to 1.007. All of which is to say that while the situation deserves a closer look — particularly with league-wide scoring having decreased from last year — this should be considered a preliminary investigation.
If the home run rate from this March and April holds up — and hereafter, I’m going to lump all games before May 1 into what we consider April, just as we do in our splits — it would represent the largest year-to-year drop since 1987–88, when the per-game rate fell from 1.06 homers per game to 0.76. If you’ve been following along with home run history, you know that the 1987 season was an outlier that marked the first time home run rates rose above 1.0 per game. While rates immediately fell back below that threshold and remained there through the next half-decade, that season served as a preview of what was to come from 1994–2009, when home run rates were above that threshold every year, likely due to a confluence of factors that ranged from expansion and newer ballparks to the widespread use of performance-enhancing drugs and changes to the baseball itself.
Last year’s per-game home run rate was the fifth highest of all time, but behind four other recent seasons:
Highest League-Wide Home Run Rates
| Season |
Games |
Home Runs |
HR/G |
| 2019 |
4858 |
6776 |
1.395 |
| 2020 |
1796* |
2304 |
1.283 |
| 2017 |
4860 |
6105 |
1.256 |
| 2021 |
4858 |
5944 |
1.224 |
| 2023 |
4860 |
5868 |
1.207 |
| 2000 |
4858 |
5693 |
1.172 |
| 2016 |
4856 |
5610 |
1.155 |
| 2018 |
4862 |
5585 |
1.149 |
| 2001 |
4858 |
5458 |
1.124 |
| 2004 |
4856 |
5451 |
1.123 |
* = Schedule reduced to 60 games per team due to COVID-19 pandemic.
Based upon the data through April 30, this year’s rate can hardly be considered an historical low, but if it held, it would rank as one of the 10 lowest of the Wild Card era:
Lowest League-Wide Home Run Rates Since 1995
| Year |
Games |
Home Runs |
HR/G |
| 2014 |
4860 |
4186 |
0.861 |
| 2011 |
4858 |
4552 |
0.937 |
| 2010 |
4860 |
4613 |
0.949 |
| 2013 |
4862 |
4661 |
0.959 |
| 2008 |
4856 |
4878 |
1.005 |
| 2015 |
4858 |
4909 |
1.010 |
| 1995 |
4034 |
4081 |
1.012 |
| 2012 |
4860 |
4934 |
1.015 |
| 2024 |
904 |
921 |
1.019 |
| 2007 |
4862 |
4957 |
1.020 |
All data through April 30.
It isn’t just home runs that are down, either. Through the end of April, scoring was down a bit over 5% relative to last season as teams fell from plating 4.62 runs per game to 4.38. Batting averages had dropped eight points (from .248 to .240) and on-base percentages six points (from .320 to .314). Slugging percentage plummeted 29 points (from .414 to .385) — we haven’t seen the league-wide slugging percentage this low since 1992 — and with another day of data, it fell to .383. Maybe commissioner Rob Manfred and his chums can come up with some rules that will help stimulate offense. Wait, they did that already? What the hell?
Before we get too far into the weeds, it’s worth remembering that April (and the end of March) features the coolest temperatures of the baseball season, when the ball doesn’t carry as far. Via Baseball Reference’s Stathead, last year there were 146 games that began with temperatures of 50 degrees Fahrenheit or lower, and 133 of those happened within a team’s first 30 games of the season, which began on March 30. Thus it’s more helpful to compare apples to apples, and Aprils to Aprils, and once we do, we see that those home run rates consistently lag behind the full-season ones:
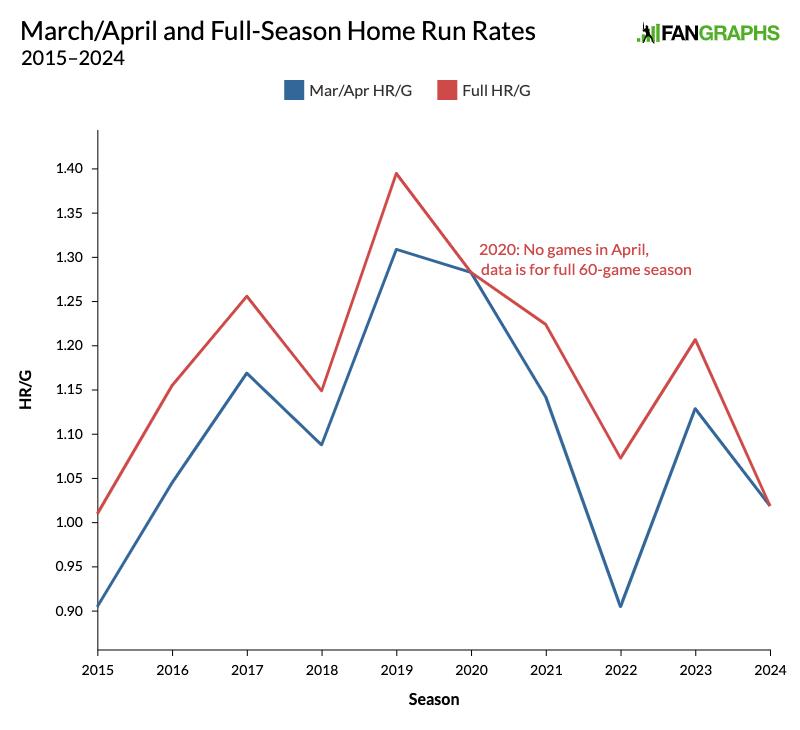
To preserve the graph’s continuity, I included the “full” 2020 data for the 60-game season, but if you ignore that point, you can see that the recent April home run rates are rather predictive of full-season rates:
April vs. Full Season Home Run Rates
| Season |
Apr HR/G |
Y/Y Change |
Full HR/G |
Y/Y Change |
Increase From April |
| 2015 |
0.905 |
+1.8% |
1.010 |
+17.3% |
0.105 |
| 2016 |
1.045 |
+15.5% |
1.155 |
+14.3% |
0.110 |
| 2017 |
1.169 |
+11.9% |
1.256 |
+8.7% |
0.087 |
| 2018 |
1.088 |
-6.9% |
1.149 |
-8.6% |
0.060 |
| 2019 |
1.309 |
+20.3% |
1.395 |
+21.4% |
0.086 |
| 2021 |
1.142 |
-12.7% |
1.224 |
-12.3% |
0.081 |
| 2022 |
0.905 |
-20.7% |
1.073 |
-12.3% |
0.168 |
| 2023 |
1.129 |
+24.7% |
1.207 |
+12.5% |
0.078 |
| 2024 |
1.019 |
-9.8% |
1.019 |
-15.6% |
— |
All statistics through April 30.
Relative to last April, home run rates fell 9.8%, a sizable drop but not the 15.6% slip we get by comparing the first month to the previous full season, with its more homer-conducive warm-weather months. Given the average gap between the April and full season rates over this period (0.097 homers per team per game) and the standard deviation (0.033 homers per game), we should expect this year’s full rate to land in the 1.083–1.148 range. At 1.116 homers per game, the center of that range would represent a 7.6% fall-off from last year, with the extremes at 4.9% and 10.3%.
Anything in that range would represent smaller year-to-year changes than we’ve seen in the post-pandemic period, but it’s still enough to merit a closer look. So what’s happening? Variations in offensive levels and strikeout rates can reduce the number of batted balls and therefore home runs, but even with what we saw in April (lower scoring but also a slightly lower strikeout rate), there were actually more fly balls per game this April than last (6.65 vs. 6.57) — it’s just that those fly balls haven’t traveled as far or done as much damage. Here’s the comparison of this season to recent full-season numbers:
Full Season Statcast Fly Ball Data Since 2018
| Season |
BA |
xBA |
SLG |
xSLG |
wOBA |
xwOBA |
EV |
Dist |
HR/FB* |
| 2018 |
.270 |
.258 |
.851 |
.809 |
.445 |
.432 |
91.6 |
319 |
16.7% |
| 2019 |
.308 |
.291 |
.988 |
.935 |
.496 |
.478 |
92.0 |
324 |
19.9% |
| 2021 |
.281 |
.274 |
.877 |
.860 |
.457 |
.455 |
92.2 |
318 |
17.1% |
| 2022 |
.266 |
.255 |
.798 |
.767 |
.432 |
.421 |
91.9 |
314 |
15.0% |
| 2023 |
.273 |
.268 |
.845 |
.833 |
.441 |
.442 |
92.1 |
316 |
16.4% |
| 2024 |
.247 |
.271 |
.738 |
.825 |
.404 |
.445 |
92.0 |
312 |
13.9% |
SOURCE: Baseball Savant
* Statcast categorizes popups separately from fly balls, so the rates here appear higher than those on FanGraphs, which include popups in their count. All data through April 30.
Balls are being hit almost as hard as last year, but they’re not going for singles, extra-base hits, or homers as often. In fact, if they held up for the rest of the season, the batting average and slugging percentage on fly balls through April would be the lowest since 2016 (.224 AVG, .709 SLG). Again, it makes more sense to compare only the April segments:
April Statcast Fly Ball Data Since 2018
| Season |
BA |
xBA |
SLG |
xSLG |
wOBA |
xwOBA |
EV |
Dist |
HR/FB* |
| 2018 |
.253 |
.278 |
.794 |
.893 |
.414 |
.473 |
92.4 |
318 |
15.3% |
| 2019 |
.285 |
.294 |
.914 |
.955 |
.458 |
.489 |
92.3 |
321 |
18.3% |
| 2021 |
.276 |
.285 |
.852 |
.907 |
.445 |
.478 |
92.6 |
318 |
16.4% |
| 2022 |
.239 |
.257 |
.698 |
.780 |
.379 |
.427 |
92.1 |
311 |
12.8% |
| 2023 |
.266 |
.272 |
.805 |
.843 |
.422 |
.447 |
92.0 |
314 |
15.3% |
| 2024 |
.247 |
.271 |
.738 |
.825 |
.404 |
.445 |
92.0 |
312 |
13.9% |
SOURCE: Baseball Savant
* Statcast categorizes popups separately from fly balls, so the rates here appear higher than those on FanGraphs, which include popups in their count. All data through April 30.
With that comparison, we see that even at the same average exit velocity, the average fly ball carried about two feet less than the comparable time last year, but one foot more than in 2022, with the associated rate stats — both actual and expected — closer to the earlier season, which is to say that those fly balls were less productive.
This raises the question of whether the ball itself has changed, something we know has happened several times in recent seasons. Changes involving the yarn, pill, leather, and drying process — which can change the seam height, leather smoothness, and bounciness of the ball — have been well documented over the years despite Major League Baseball’s lack of transparency. The league’s purchase of about 25% of Rawlings, the ball’s manufacturer, seems to have accelerated the pace of change. Sometimes, multiple makes of the ball have been used during the same season, and quite possibly in the same game, given the anecdotes of pitchers reporting ball-to-ball variability. As documented by Insider’s Bradford William Davis, with research by Dr. Meredith Wills, apparently three different versions of the ball were used in 2022.
Early last year, when home run rates were on the rise relative to 2022 — when Aaron Judge nonetheless broke the long-standing American League home run record with 62 — Rob Arthur reported that the balls’ drag coefficient — as estimated from Statcast pitch tracking data based on a method developed by Alan Nathan and David Kagan — had decreased from 2022, portending an increase in home run rates. Per data now published at Baseball Savant’s Drag Dashboard, we can see that the drag coefficient did increase somewhat as the season went on:
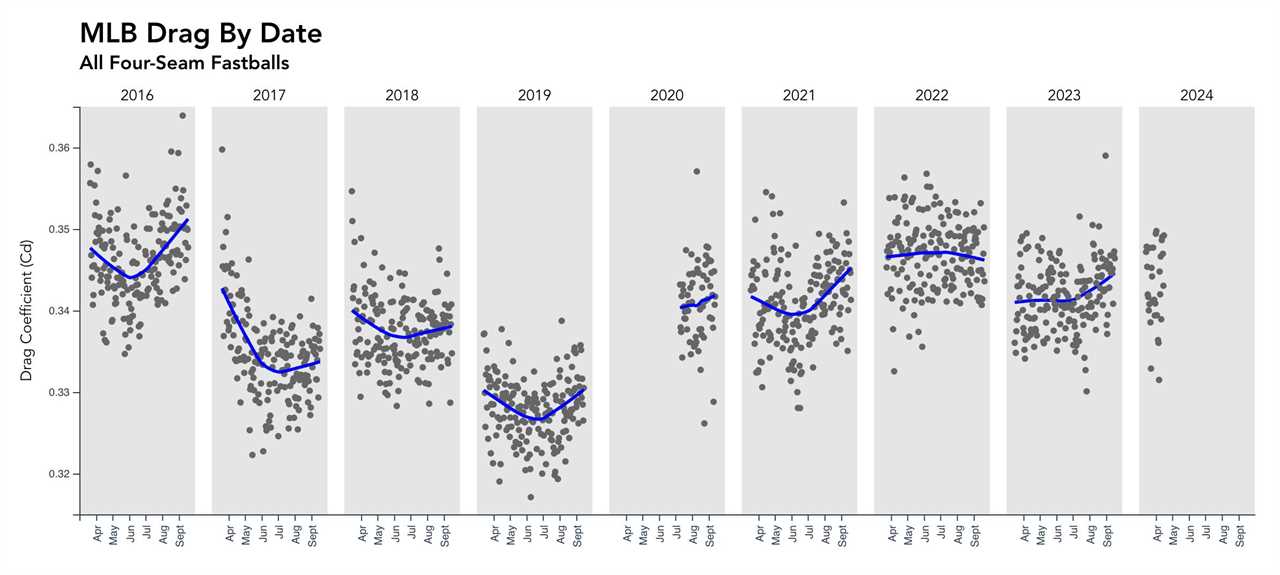
Source: Baseball Savant
The final estimated mean drag coefficient (.3417) still wound up lower than in 2022 (.3469); the .0052 decrease was pretty close in magnitude to the increase from ’21 to ’22 (.0058), but the change went in the other direction. The increase so far this season relative to 2023 is much smaller:
Estimated Mean Drag Coefficient by Season
| Season |
Est Mean Drag Coeff |
Change |
| 2018 |
0.3374 |
+0.0028 |
| 2019 |
0.3279 |
-0.0095 |
| 2020 |
0.3410 |
+0.0131 |
| 2021 |
0.3411 |
+0.0001 |
| 2022 |
0.3469 |
+0.0058 |
| 2023 |
0.3417 |
-0.0052 |
| 2024 |
0.3426 |
+0.0009 |
SOURCE: Baseball Savant
According to that Savant dashboard, “As a general rule of thumb, a decrease in the drag coefficient of 0.01 will increase the distance of a batted ball with an exit velocity of 100 mph by approximately 5 feet (and an increase of 0.01 will decrease batted ball distance by 5 feet).” With the exception of the change from 2019 to the shortened ’20 season, none of the annual changes rise to that threshold, and the current one is a full order of magnitude smaller. Based on the reported data, the change in drag isn’t enough to account for what we’re seeing, particularly given MLB’s notoriously loose tolerances in its ball specifications. As the page notes, “[W]hile drag fluctuates from year to year, these changes are small relative to the ball-to-ball variation observed within an individual season… Relative to this small difference, the standard deviations of the drag coefficients are large.”
Beyond drag, changes in the ball’s coefficient of restitution and weight, as affected by the humidity level, can also affect the behavior of the ball. In 2022, the use of humidors became mandatory for all 30 teams, where only 10 used them the year before; those at all locations besides Coors Field are set to 70 degrees and 57% relative humidity (it’s 62% at Coors). But because humidity levels vary throughout the season, even with such controls, the COR will vary as well.
Dr. Wills has begun collecting 2024 baseballs to dissect, but for the moment we don’t have enough evidence to suggest that the ball has changed, and even if it had, that’s not to say such change is intentional. For as critical as Dr. Wills has been of MLB’s lack of transparency in recent years, she acknowledged to FanGraphs, “Those kind of systematic differences seem to happen when they move from one production cycle to the next. It’s the sort of thing you might expect with supply turnover and machinery refurbishment.” Beyond that, variations in temperature, humidity, wind, and other environmental factors could be contributing to what still counts as a comparatively small change in average fly ball distance, and likewise variable performance factors such as launch and spray angles.
All of this is yet another reminder that we’re still early in the season. Recent history tells us that we have enough data to know that we’ll wind up with a lower league-wide home run rate this year than last, albeit not to the extreme we’ve seen so far. And while our appreciation of the league’s home run rate may be subjective (not everyone wants more homers), it’s reasonable to hope that Trout will return soon enough to do his small part — and likewise, thumpers such as Judge and Matt Olson, who are off to slow starts — in making sure that it doesn’t drop any further.
Source
https://blogs.fangraphs.com/where-have-all-the-home-runs-gone-its-too-early-to-tell/
