Kyle Ross-USA TODAY Sports
We will not be breaking new ground today. What you read in this article won’t change the way you understand baseball. However, it might help you to appreciate a few baseball players for who they are, and that strikes me as a noble goal. A couple weeks ago, Ben Clemens introduced Whomps Per Whiff, a stat that divides barrels by whiffs in order to show “how often you absolutely whomp the ball, as compared to how often your swing results in nothing but a tiny gust of air.” It was a remarkably simple way of looking at hitting, and the leaderboard featured some of the best hitters in baseball. It was also a fun article, and I agreed with several of its underlying premises:
- If there’s one thing baseball doesn’t have enough of, it’s statistics.
- Anybody can make up a statistic, as long as they have a dream in their heart and a copy of Microsoft Excel.
- It’s important that those statistics have silly names. That’s why I’ve been lobbying to have people pronounce wRC+ as “Work-Plus,” preferably in a Rihanna voice.
- The word whomp is decidedly fun.
Those last two points stuck with me. I’m a sucker for scansion, and it turns out that Whomps Per Whiff immediately and irrevocably makes me think of the Pixies album Trompe Le Monde. Whether or not the Pixies’ muscular brand of buzzy, effortfully ramshackle indie rock is your cup of tea, that title is entirely too much fun, and it’s always lurking in my subconscious, waiting for any excuse to tromp all over my train of thought. From there, it was inevitable that I would start wondering about Tromps Per Whomp. I couldn’t help it.
A Tromp — maybe you’ve already gathered this, or maybe things are a little more orderly inside your head — means a home run, which allows the batter to tromp around the bases like an ebullient baby elephant. Although this train of thought started with wordplay, I really did start wondering which players are the best at turning their hard contact into home runs. Ben defined Whomps as barrels, balls hit at least 98 mph at launch angles between 25 and 31 degrees. Since barrels are the most productive hard-hit balls — that’s expressly why the stat was created — they make a poor denominator for our purposes. Instead, I defined a Whomp as any hard-hit ball, meaning any ball hit at least 95 mph. With that, let’s take a look at our 2023 Tromps Per Whomp leaderboard:
The Trompiest Whompers of 2023
Minimum 300 Plate Appearances
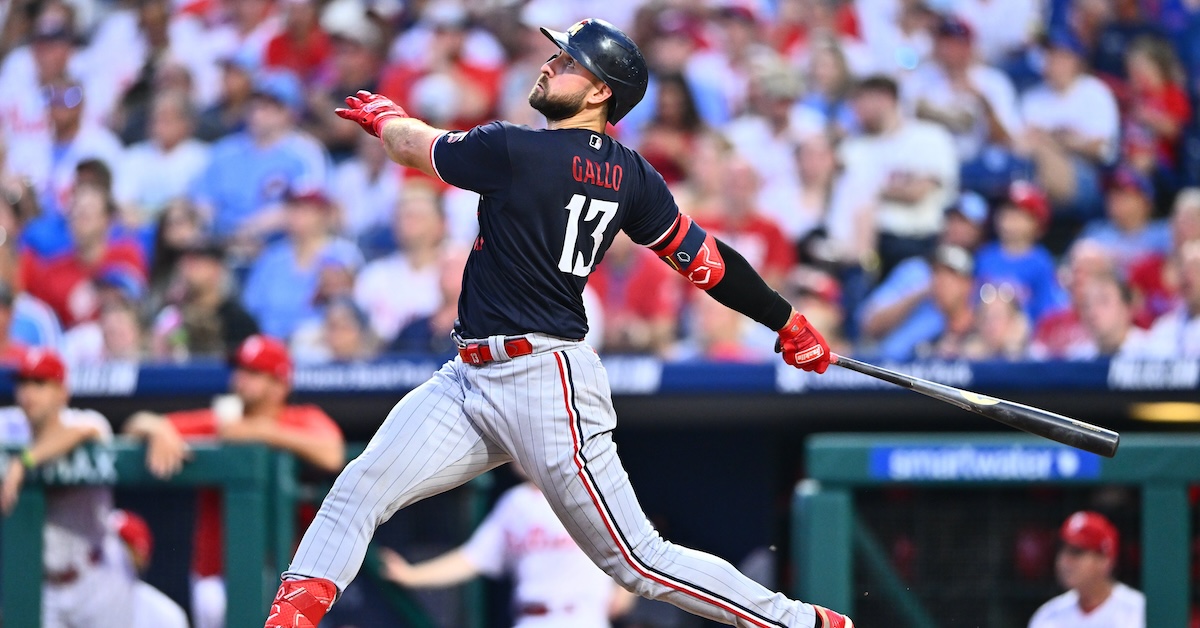
Most of the players on this list are good hitters, and there is a strong correlation between Tromps Per Whomp and overall stats like wRC+ and wOBA (r = .51 for both of them). Better players tend to tromp more, both overall and on a per-whomp basis. However, this is definitely not exclusively a list of the best hitters in baseball. The players range from Michael A. Taylor’s 96 wRC+ to Aaron Judge’s 174. These 10 guys take a couple routes to maximizing production when they hit the ball hard. Some take the Isaac Paredes approach by pulling over half of their balls in play; some take the Adam Duvall approach by running fly ball rates above 50% and average launch angles above 20 degrees (a friendly ballpark also helps with this approach). Some take the Aaron Judge approach by hitting the ball so preposterously hard that anything that isn’t hit directly into the ground has a chance at clearing the fence. Most take a little from column A and a little from column B. Joey Gallo treats the whole thing like it’s his personal all-you-can-eat buffet.
The other thing that everyone on the list has in common is an extreme tendency towards whiffs and strikeouts. That makes sense not only because sluggers tend to have all-or-nothing swings, but because if you’re striking out 30% of the time, the only way to remain productive enough to keep being allowed to play is to absolutely demolish the ball when you do make contact. Not everybody who makes this list is making up for a hole in their game — Mike Trout and Judge were at the top of the list in 2022 — but most are.
Surfing around the leaderboard, the parameters become clear pretty quickly. Anything above .210 is elite, and anything above .150 puts you in the 75th percentile. League average is roughly .120, and the scale goes all the way down to zero. Knowing all of that, look how far ahead Jose Siri is! He’s 32 points ahead of Gallo in second place. The gap between Siri and Gallo is nearly as big as the gap between Gallo and Duvall in eighth pace. Unlike most of the players on the list, Siri didn’t circumvent the system by hitting any home runs that weren’t on hard-hit balls. When he hits a ball hard, that ball is gone. From 2022 to 2023, Siri got more aggressive in the zone and increased his pull and fly ball rates in a big way. Those changes were well worth an increase in his strikeout rate:
Jose Siri Sells Out
| Year |
PA |
BB% |
K% |
FB% |
Pull% |
Contact% |
wRC+ |
| 2022 |
325 |
6.2 |
33.2 |
36.3 |
40.2 |
66 |
75 |
| 2023 |
364 |
5.5 |
35.7 |
45 |
48.6 |
61.6 |
106 |
I mentioned earlier that the floor of Tromps Per Whomp goes all the way down to zero. Let’s take a look at the bottom by flipping our numerator and denominator. Here are your leaders in Whomps Per Tromp:
2023 Whomps Per Tromp “Leaders”
Minimum 300 Plate Appearances
Poor Tim Anderson had a rough 2023 season. His career Tromps Per Whomp is .099. That’s not great, but it’s not disastrous. In 2023, however, Anderson led all qualified players in groundball rate and turned just one of his 146 hard-hit balls into a homer, dropping him all the way to .007. That is entirely too much James Bond and not nearly enough Barry Bonds. On the other hand, Myles Straw should feel right at home in second place. His career mark of .017 ranks above only Magneuris Sierra, who has yet to homer in 636 plate appearances. Defensive whiz Maikel Garcia’s appearance on this list, along with his 48.3% groundball rate, helps explain why he only had an ISO above .118 in one of his 10 minor league stops.
What can we learn from Tromps Per Whomp? First of all, we can learn that no matter what stat you make up, as long as it involves power, you’re going to find Aaron Judge’s name somewhere near the top. Second, I think it’s a good way to demonstrate the shape of a player’s production, which is something I think about more and more these days. There’s more than one way to be productive at the plate. Some do it with plate discipline. Some do it with contact ability, speed, power, or getting hit by tons of pitches. A select few are able to do it by consistently hitting line drives. This stat showcases the players whose production comes not just from light-tower power, but from optimized power.
Usually, power and contact ability are at odds with one another, which is why Whomps Per Whiff is such an elegant stat. By recognizing players who balance those competing concerns, it takes players whose production comes in wildly different shapes and puts them on an even footing. As befits its name, Tromps Per Whomp is clumsier and clompier. With whomps as the denominator instead of the numerator, players who make tons of hard contact get penalized, and players who avoid whiffs aren’t rewarded. Juan Soto ranks 91st, Freddie Freeman and Ronald Acuña Jr. are at 111 and 112, and Julio Rodríguez is down at 125. Great hitters like Yandy Díaz, Vladimir Guerrero Jr., and Luis Arraez are all below average. We’re targeting a much more specific type of hitter.
You could argue that Tromps Per Whomp specifically showcases players who manage to hit home runs despite having an imperfect overall approach, but I would encourage you to think of it in a different way. Because it highlights players who get the most production from their hard contact, you could instead think of it as highlighting players who don’t need to make as much hard contact in order to inflict a lot of damage. If you’re like me, you watch Siri, a defensive wizard who strikes out at an alarming rate, and wonder whether he’ll ever be able to cut down on the whiffs. But maybe that’s the wrong way to look at him! Not every player has a well-rounded approach, and just because he’s an all-world center fielder doesn’t mean that he has to slash and dash like Otis Nixon. Siri hit nearly one home run for every three hard-hit balls, which is how he was able to post a 107 wRC+ despite putting up the worst contact and strikeout rates of any player with at least 350 PAs. Maybe we should be looking at him the same way we look at Gallo or those tube worms that subsist on gas from hydrothermal vents on the ocean floor — as someone who makes it work by living at the extremes.
If you’re a fan of Patrick Wisdom, this list should allow you to do yourself the kindness of being a least a little less frightened by his eye-popping strikeout rates. They’re not fun to look at, but as long as Wisdom can keep clobbering the baseball, he can make the whole package work. The same goes for Wisdom’s teammate Christopher Morel, who comes in at no. 30, but Wisdom has been walking this tightrope for even longer. In fact, let’s take a look at the top 10 through the entire Statcast era:
The Trompiest Whompers From 2015 to 2023
| Player |
Tromps |
Whomps |
Tromps Per Whomp |
| Joey Gallo |
198 |
722 |
.274 |
| Aristides Aquino |
41 |
155 |
.265 |
| Patrick Wisdom |
80 |
334 |
.240 |
| Pete Alonso |
192 |
824 |
.233 |
| Jose Siri |
36 |
156 |
.231 |
| Chris Carter |
73 |
319 |
.229 |
| Jake Rogers |
31 |
137 |
.226 |
| Mike Trout |
270 |
1195 |
.226 |
| Eric Thames |
75 |
333 |
.225 |
| Kyle Schwarber |
246 |
1094 |
.225 |
Minimum 600 Plate Appearances
It’s no surprise that Gallo is first, but I was surprised to see Wisdom third. He’s been in the big leagues since 2018, and has played in at least 95 games each of the last three seasons. It seems safe to say that he will be able to keep getting his money’s worth whenever he connects. Pete Alonso is in fourth place in both lists. Judge is 11th, and both Duvall and Paredes finished in the top 20.
We can also play with our parameters. If we increase our Whomp threshold to 100 mph, Tromps Per Whomp has a much weaker correlation to a player’s exit velocity stats and their overall quality at the plate. Instead, it becomes almost exclusively about fly ball rate and pull rate. That allows Paredes to leap into first place at a jarring .633, more than 200 points above Siri in third place. Amazingly, Tony Kemp, who homered five times and hit just nine balls over 100 mph, jumps all the way from 242nd place to second:
2023 Tromps Per Über-Whomp Leaders
| Player |
Tromps |
Über-Whomps |
Tromps Per Über-Whomp |
| Isaac Paredes |
31 |
49 |
.633 |
| Tony Kemp |
5 |
9 |
.556 |
| Jose Siri |
25 |
59 |
.424 |
| Adam Frazier |
13 |
31 |
.419 |
| Patrick Wisdom |
23 |
58 |
.397 |
| Adam Duvall |
21 |
53 |
.396 |
| Wilmer Flores |
23 |
59 |
.390 |
| Danny Jansen |
17 |
44 |
.386 |
| Ozzie Albies |
33 |
86 |
.384 |
| Joey Gallo |
21 |
55 |
.382 |
There are plenty more ways to tweak things. We could redefine Tromps by looking at production rather than home runs. If we look at wOBA on hard-hit balls, Siri is still in the top spot at .951, and Nolan Jones isn’t far behind him. If we look at xwOBA, Judge comes out on top, Siri drops down to second, and Jones comes in at third. Or we could look at things on a team level. Despite not having any players in the top 10, the Braves and their 307 home runs ranked first with .153 Tromps Per Whomp. Despite hitting the third-fewest hard-hit balls, the Guardians and their 124 homers still ranked at the bottom with .085. That’s the beautiful thing about making up a silly stat with a silly name. You can customize it any way you like. If you want to see the full 2023 and Statcast era Tromp Per Whomp leaderboards, click here. If you want to use Tromps Per Whomp to learn anything about baseball, do so at your own peril.
Source
https://blogs.fangraphs.com/tromps-per-whomp-is-a-fake-stat-now/
